


Introduction
When I first encountered UML Activity Diagrams during a system design workshop, I’ll admit—I was skeptical. “Another diagramming notation?” I thought. But after spending weeks integrating activity diagrams into real-world projects, from business process modeling to software workflow documentation, my perspective shifted dramatically.

This guide shares my practical experience learning, applying, and eventually mastering activity diagrams, along with the tools and techniques that made the journey smoother. Whether you’re a business analyst mapping customer journeys, a developer documenting system logic, or a student learning UML for the first time, I hope this walkthrough helps you see activity diagrams not as academic exercises, but as powerful, living documents that bring clarity to complex processes.
What Is an Activity Diagram? (And Why Should You Care?)
Activity diagrams are behavioral diagrams in the Unified Modeling Language (UML) that describe the dynamic aspects of a system. Think of them as an advanced, more expressive version of flowcharts—they model the flow from one activity to another, capturing decisions, parallel processes, and object interactions along the way.

What struck me most when I started using them was their versatility. Unlike simple flowcharts, activity diagrams can represent:
-
Concurrent processes (multiple things happening at once)
-
Conditional logic (if/then scenarios)
-
Object flows (how data moves between activities)
-
Role-based responsibilities (via swimlanes)
This makes them invaluable for modeling everything from user onboarding flows to backend microservice interactions.
When I Actually Use Activity Diagrams (Real-World Scenarios)
Early on, I used to force activity diagrams into every project. Now, I’m more strategic. Here’s when they truly shine in my workflow:
-
Identifying candidate use cases by examining business workflows
-
Defining pre- and post-conditions for complex operations
-
Modeling workflows between or within use cases, especially when activities overlap
-
Documenting complex operations on objects that involve multiple steps
-
Breaking down high-level activities into detailed sub-processes
A practical example: When our team was redesigning an e-commerce checkout process, we used an activity diagram to visualize parallel tasks (payment processing + inventory reservation) and conditional paths (guest vs. registered user flows). It became our single source of truth during stakeholder reviews.
Learning by Doing: Activity Diagram Examples That Clicked for Me
A Basic Activity Diagram – Flowchart Style
Starting simple helped me build confidence. This basic example shows a linear flow with a decision point—perfect for understanding core notation.

Modeling a Word Processor Workflow
This example resonated because it mirrored tasks I perform daily. The diagram breaks down document creation into clear, conditional steps:
-
Open the word processing package
-
Create a file
-
Save the file under a unique name
-
Type the document
-
If graphics are necessary, open the graphics package, create graphics, and paste them in
-
If a spreadsheet is necessary, open the spreadsheet package, create it, and paste it in
-
Save the file
-
Print a hard copy
-
Exit the package
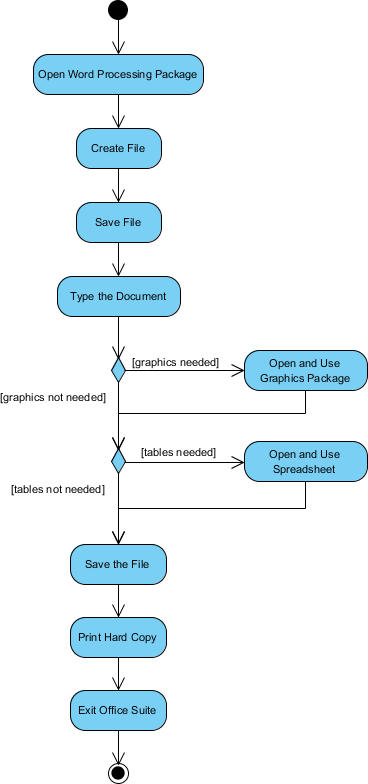
What I appreciated: The use of decision nodes (diamonds) for conditional logic and fork/join nodes for parallel tasks made the complexity manageable.
Process Order Workflow – Handling Parallelism
This example taught me how to model concurrent processes—a game-changer for system design:
“Once the order is received, activities split into two parallel sets: one fills and ships the order, the other handles billing. Delivery method is decided conditionally (overnight vs. regular). Finally, parallel activities merge to close the order.”
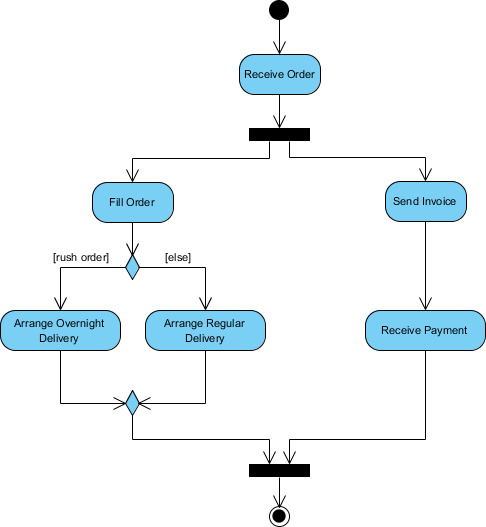
Key takeaway: Fork nodes (thick black bars) split flow into parallel paths; join nodes synchronize them back. This pattern is everywhere in modern distributed systems.
Student Enrollment Process – Real Business Logic
This university enrollment example showed me how activity diagrams can capture nuanced business rules:
-
Applicant submits enrollment form
-
Registrar inspects forms
-
If forms are complete, student attends overview presentation
-
Registrar helps enroll in seminars
-
Student pays initial tuition

I loved how this diagram made implicit approval steps explicit—critical for compliance and training documentation.
Swimlanes: Organizing Complexity by Role
Early diagrams I created were messy—everything in one lane. Then I discovered swimlanes (also called partitions), which group activities by actor or system component.

Before and After: The Swimlane Difference
Without swimlanes, this client onboarding process was hard to follow:

With swimlanes, responsibilities became crystal clear:

Pro tip from my experience: Use swimlanes when multiple teams or systems interact. They prevent “who does what?” confusion during reviews.
Activity Diagram Notation Cheat Sheet (What I Keep Handy)
| Notation Description | UML Notation |
|---|---|
| Activity: A set of actions |  |
| Action: A single task |  |
| Control Flow: Sequence of execution |  |
| Object Flow: Flow of objects between actions |  |
| Initial Node: Start point |  |
| Activity Final Node: End point |  |
| Object Node: Represents an object in flow |  |
| Decision Node: Conditional branching |  |
| Merge Node: Rejoin decision paths |  |
| Fork Node: Split into parallel flows |  |
| Join Node: Synchronize parallel flows |  |
| Swimlane/Partition: Group by actor or thread |  |
I printed this table and kept it on my desk for months. Now, the notation feels second nature.
Getting Started: Drawing Your First Activity Diagram
You don’t need expensive tools to begin. I started with Visual Paradigm Community Edition—a free, award-winning UML tool that supports all diagram types. It’s intuitive enough for beginners but powerful enough for enterprise use.
My beginner workflow:
-
Sketch the process on paper first (low-tech, high-clarity)
-
Identify key actions, decisions, and actors
-
Map them using the notation cheat sheet above
-
Refine in the tool, adding swimlanes and object flows as needed
-
Share with stakeholders for feedback
The tool’s drag-and-drop interface made iteration fast. I could experiment with different layouts without redrawing everything.
Level Up: Animating Activity Diagrams for Better Communication
One feature that transformed how I present diagrams: animation. Instead of statically explaining a flow, I can now show it in action.
Here’s how I animate a “Place Order” diagram:
-
Open the diagram in Visual Paradigm
-
Click Show Action Bar on the right
-
Click the animation button to open the Activity Diagram Animation window
-
Paths are auto-detected—I renamed them to Rejection and Acceptance for clarity
-
Select a path and click play: a token traverses the flow, highlighting each step


During presentations, I pause the animation at decision points to discuss alternatives. Stakeholders engage more when they see the logic unfold.
Exporting Animations for Sharing
Need to share with remote teams? Export animations as HTML:
-
In the Animation window, select paths to export
-
Click Export to Flash…
-
Set output path and dimensions (800×600 works well)
-
Click Export


The HTML file opens in any browser—no special software needed. Perfect for asynchronous reviews.
The AI Revolution: Smarter Activity Diagrams, Faster
Recently, I explored Visual Paradigm’s AI-powered features, and they’ve significantly accelerated my workflow.
AI-Powered Activity Diagram Features
-
Text-to-Diagram Generation: Paste a user story or process description, and the AI generates a structured activity diagram instantly.
-
Automated Use Case Transformation: Start with a simple goal statement; the AI builds full use case specs and visualizes them as activity diagrams.
-
Intelligent Refinement: Chat with the AI to modify diagrams: “Add error handling for payment failure” or “Rename this action to ‘Validate Credentials’.”
-
Layout & Style Automation: The AI handles symbol placement, alignment, and cleanup—ensuring professional, standards-compliant results.
OpenDocs Integration: Diagrams Meet Documentation
OpenDocs is a web-based, AI-powered knowledge platform that unifies diagrams and documentation:
-
Unified Workspace: Write text and embed diagrams without switching tabs.
-
Send to OpenDocs Pipeline: Export diagrams directly from Visual Paradigm; revisions are tracked, and updates sync with one click.
-
Knowledge Base Organization: Build hierarchical folders for project notes, architecture diagrams, and requirements.
-
AI Content Tools: Beyond diagrams, use AI for drafting, summarizing, and Q&A within your docs.
How I Access AI Support
-
Visual Paradigm Desktop: Go to Tools > AI Diagram to generate from notes or topics.
-
Visual Paradigm Online: Click “Create with AI” to launch specialized apps like “Use Case to Activity Diagram.”
-
Chatbot Interface: Use natural language to create, edit, or refine models conversationally.
The AI doesn’t replace my judgment—it amplifies it. I spend less time on layout and more on validating logic and gathering stakeholder input.
Conclusion: Why Activity Diagrams Earned a Permanent Spot in My Toolkit
Looking back, my journey with activity diagrams mirrors a broader truth in software and business analysis: clarity beats complexity. Activity diagrams force you to articulate processes explicitly, exposing gaps, redundancies, and opportunities you might otherwise overlook.
They’re not just for UML purists or enterprise architects. Whether you’re mapping a customer support workflow, designing an API integration, or onboarding a new team member, activity diagrams provide a shared visual language that bridges technical and non-technical stakeholders.
My advice for anyone starting out:
-
Begin with simple, linear flows before tackling parallelism
-
Use swimlanes early to clarify responsibilities
-
Leverage animation to make reviews more engaging
-
Explore AI tools to accelerate iteration—but always validate the logic yourself
Most importantly, treat activity diagrams as living documents. Update them as processes evolve, and they’ll remain valuable long after the initial design phase.
If you take one thing from my experience, let it be this: Activity diagrams aren’t about perfect notation—they’re about better conversations. And in a world of complex systems and distributed teams, that’s worth its weight in gold.
References
- What is Activity Diagram? | Visual Paradigm: Comprehensive guide explaining activity diagrams in UML, including notation, examples, and best practices for modeling workflows.
- AI-Powered Use Case to Activity Diagram Generator | Visual Paradigm: Tool overview for automatically transforming use case specifications into visual activity diagrams using AI.
- OpenDocs: AI-Powered Knowledge Management Platform | Visual Paradigm: Introduction to OpenDocs, a unified platform for integrating diagrams, documentation, and AI-powered content tools.
- How Visual Paradigm’s AI-Powered Ecosystem Transforms UML Development: Third-party review of Visual Paradigm’s AI features and their impact on UML modeling workflows.
- Export Cloud Diagrams from Visual Paradigm Online to OpenDocs: Tutorial on seamlessly exporting diagrams from Visual Paradigm Online into the OpenDocs documentation pipeline.
- Visual Paradigm Desktop: AI Activity Diagram Generation: Release notes detailing AI-powered activity diagram creation features in the desktop application.
- AI Diagram Generator Release | Visual Paradigm: Announcement of the AI Diagram Generator feature for converting text descriptions into UML diagrams.
- Visual Paradigm AI Chatbot: Overview of the conversational AI interface for creating and refining UML models via natural language.
- Comprehensive Review: Visual Paradigm’s AI Diagram Generation Features: Independent evaluation of AI capabilities for diagram automation and refinement.
- Use Case Modeling Studio | Visual Paradigm AI: Specialized AI tool for generating use case specifications and corresponding activity diagrams.
- Enhanced AI Activity Diagram Support in Visual Paradigm AI Chatbot: Update on improved AI chatbot functionality for activity diagram editing and generation.
- Visual Paradigm Desktop: AI Activity Diagram Generation (Detailed): In-depth look at desktop AI features for activity diagram automation.
- Visual Paradigm OpenDocs: Complete Developer’s Guide: Developer-focused guide to using OpenDocs for AI-enhanced technical documentation.
- Sync AI Diagrams to OpenDocs Pipeline Guide: Step-by-step tutorial for integrating AI-generated diagrams into OpenDocs workflows.
- OpenDocs AI Tool | Visual Paradigm: Dedicated page for OpenDocs AI features, including content generation and diagram integration.
- OpenDocs AI-Powered Knowledge Platform Overview: Official description of OpenDocs as an interactive, AI-driven knowledge base solution.
- Enhance Design Thinking with New AI Diagram Generation: Release highlighting AI tools for accelerating design thinking and diagram creation.
- Generate Activity Diagrams from Use Cases Instantly | Visual Paradigm Blog: Blog post demonstrating rapid activity diagram generation from use case inputs.
- Enhanced AI Activity Diagram Support in Visual Paradigm AI Chatbot (Update): Follow-up release notes on chatbot improvements for activity diagram workflows.
- Visual Paradigm Community Edition Download: Free download page for Visual Paradigm Community Edition, a full-featured UML tool for learning and professional use.