Introduction: The Documentation Revolution Starts Here
In the fast-paced world of software development, there’s an uncomfortable truth we all face: our documentation is almost always outdated. We’ve spent countless hours wrestling with drag-and-drop diagramming tools, painstakingly aligning boxes and arrows, only to watch our carefully crafted visuals become obsolete the moment the code changes.
But what if documentation could keep pace with development? What if creating professional architecture diagrams was as simple as writing a function?
Welcome to the Diagram-as-Code revolution. This tutorial will guide you through VPasCode, Visual Paradigm’s browser-based platform that transforms how teams create, share, and maintain system architecture diagrams. By treating diagrams as code, you’ll discover how to produce publication-quality visuals in minutes—not hours—while ensuring your documentation evolves seamlessly alongside your systems.
Whether you’re a developer documenting microservices, an architect presenting to stakeholders, or a DevOps engineer mapping infrastructure, this comprehensive guide will equip you with the skills to master VPasCode and elevate your team’s documentation game.
1. Getting Started: Your First Diagram in 5 Minutes {#getting-started}
No Installation, No Setup, Just Code
One of VPasCode’s most powerful features is its zero-friction onboarding. There’s nothing to install, no accounts to create, and no complex configuration. Let’s create your first diagram right now.
Step-by-Step Quick Start:
-
Navigate to VPasCode: Open your browser and visit https://www.vpascode.com/
-
Choose Your Engine: Select from the dropdown menu:
-
Mermaid – Best for flowcharts and modern documentation
-
PlantUML – Ideal for UML and enterprise architecture
-
Graphviz – Perfect for complex network topologies
-
-
Load a Template: Click “Examples” and select a starter template
-
Edit and Preview: Modify the code in the left panel; watch your diagram update instantly on the right
-
Export or Share: Download as SVG/PNG or copy the shareable URL

Figure 1: VPasCode transforms text-based code into professional architecture diagrams instantly
2. Understanding the VPasCode Interface {#interface}
Before diving deep into syntax, let’s familiarize ourselves with the workspace.
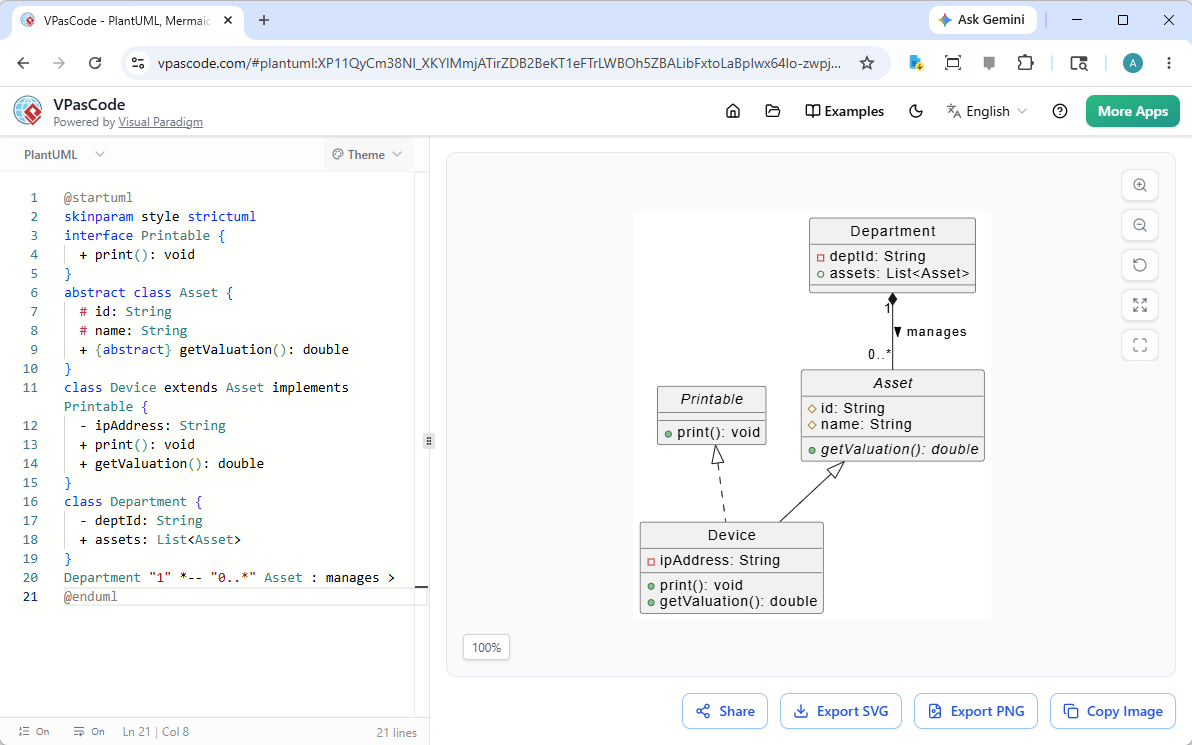
Figure 2: The dual-panel VPasCode interface—code on the left, live preview on the right
Interface Components Breakdown:
Left Panel (Code Editor):
-
Syntax-highlighted text editor
-
Line numbers for easy reference
-
Auto-completion support
-
Error highlighting in real-time
Right Panel (Live Preview):
-
Instant visual rendering
-
Pan and zoom controls
-
Vector-based display (crisp at any zoom level)
-
Click-to-inspect elements
Top Toolbar:
-
Engine selector (Mermaid/PlantUML/Graphviz)
-
Template gallery
-
Export options (SVG, PNG, PDF)
-
Share button (generates permanent URL)
-
Settings and preferences
Bottom Status Bar:
-
Syntax validation status
-
Character count
-
Last saved timestamp
-
Keyboard shortcuts reference
Core Workflow Principle:
Write Code → See Instant Preview → Refine → Export/Share
This immediate feedback loop is what makes VPasCode so powerful. There’s no “render” button to click, no waiting for compilation—just pure, instant visual feedback as you type.
3. Mastering Mermaid.js: Flowcharts and Beyond {#mermaid-tutorial}
Mermaid.js has become the de facto standard for developer-friendly diagramming. Its syntax is intuitive, readable, and perfect for documentation that lives alongside code.
Tutorial 1: Creating a User Authentication Flow
Let’s build a practical authentication flow diagram that you might use in your next sprint planning.
Example Code:
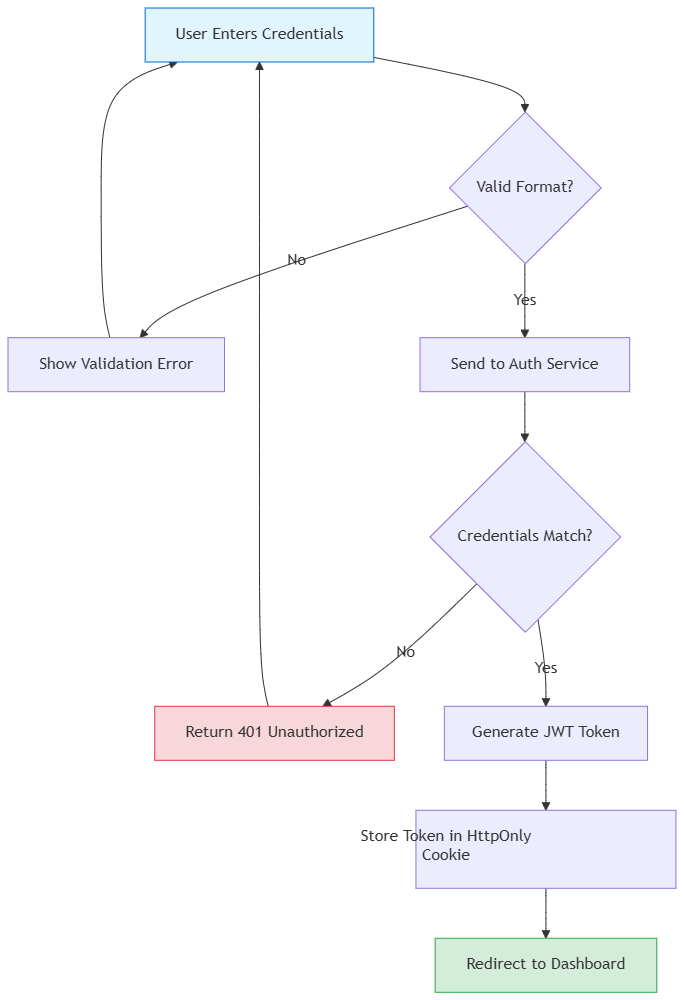
graph TD
    A[User Enters Credentials] --> B{Valid Format?}
    B -->|No| C[Show Validation Error]
    B -->|Yes| D[Send to Auth Service]
    C --> A
    D --> E{Credentials Match?}
    E -->|No| F[Return 401 Unauthorized]
    E -->|Yes| G[Generate JWT Token]
    G --> H[Store Token in HttpOnly Cookie]
    H --> I[Redirect to Dashboard]
    F --> A

    style A fill:#e1f5ff,stroke:#0066cc
    style I fill:#d4edda,stroke:#28a745
    style F fill:#f8d7da,stroke:#dc3545
What This Demonstrates:
-
Decision nodes (diamonds with
{?}) -
Directional flow (
TD= Top-Down) -
Custom styling with colors
-
Self-referencing loops
-
Clear labeling
Tutorial 2: Microservices Architecture Diagram
Now let’s create a more complex system architecture showing service relationships.
Example Code:
graph LR
    subgraph Client["Client Layer"]
        Web[Web App<br/>React]
        Mobile[Mobile App<br/>Flutter]
    end

    subgraph API["API Gateway"]
        Gateway[ Kong Gateway ]
        Auth[Auth Service]
        Rate[Rate Limiter]
    end

    subgraph Services["Business Services"]
        User[User Service]
        Order[Order Service]
        Product[Product Service]
        Payment[Payment Service]
    end

    subgraph Data["Data Layer"]
        UserDB[(User DB<br/>PostgreSQL)]
        OrderDB[(Order DB<br/>MongoDB)]
        ProductDB[(Product DB<br/>PostgreSQL)]
        Cache[(Redis Cache)]
    end

    Web --> Gateway
    Mobile --> Gateway
    Gateway --> Auth
    Gateway --> Rate
    Rate --> User
    Rate --> Order
    Rate --> Product
    User --> UserDB
    User --> Cache
    Order --> OrderDB
    Order --> Payment
    Product --> ProductDB
    Payment --> OrderDB

    style Gateway fill:#ff6b6b,stroke:#c92a2a,color:white
    style UserDB fill:#4ecdc4,stroke:#087f5b
    style OrderDB fill:#4ecdc4,stroke:#087f5b
    style ProductDB fill:#4ecdc4,stroke:#087f5b
    style Cache fill:#ffe66d,stroke:#f08c00
Key Concepts:
-
subgraphfor logical grouping -
LRfor Left-to-Right layout -
Multi-line labels with
<br/> -
Database cylinder notation with
[( )] -
Complex routing and relationships
Tutorial 3: Sequence Diagram for Order Processing
Sequence diagrams are essential for understanding temporal interactions between components.
Example Code:
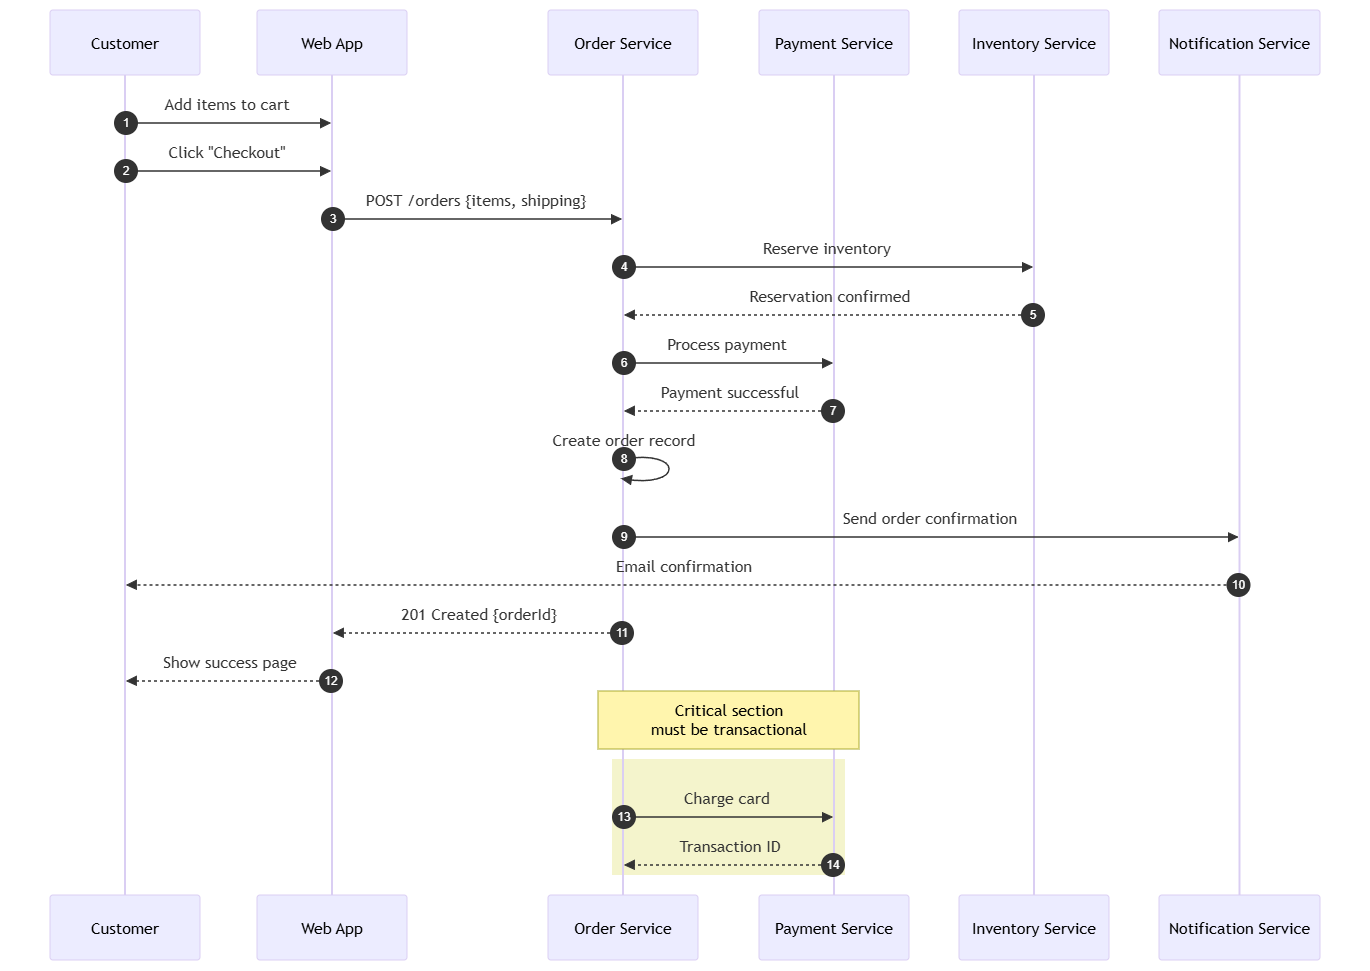
sequenceDiagram
    autonumber
    participant C as Customer
    participant W as Web App
    participant O as Order Service
    participant P as Payment Service
    participant I as Inventory Service
    participant N as Notification Service

    C->>W: Add items to cart
    C->>W: Click "Checkout"
    W->>O: POST /orders {items, shipping}
    O->>I: Reserve inventory
    I-->>O: Reservation confirmed
    O->>P: Process payment
    P-->>O: Payment successful
    O->>O: Create order record
    O->>N: Send order confirmation
    N-->>C: Email confirmation
    O-->>W: 201 Created {orderId}
    W-->>C: Show success page

    Note over O,P: Critical section<br/>must be transactional
    rect rgba(200, 200, 0, 0.2)
        O->>P: Charge card
        P-->>O: Transaction ID
    end
Sequence Diagram Features:
-
autonumberfor automatic step numbering -
participantdeclarations -
->>for synchronous calls -
-->>for responses -
Note overfor annotations -
rectfor highlighting sections
Tutorial 4: Gantt Chart for Sprint Planning
Mermaid also supports project timeline visualization.
Example Code:
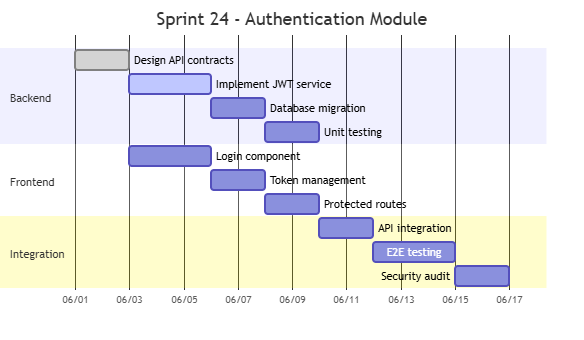
gantt
    title Sprint 24 - Authentication Module
    dateFormat  YYYY-MM-DD
    axisFormat  %m/%d

    section Backend
    Design API contracts       :done,    des1, 2024-06-01, 2d
    Implement JWT service      :active,  des2, 2024-06-03, 3d
    Database migration         :         des3, after des2, 2d
    Unit testing              :         des4, after des3, 2d

    section Frontend
    Login component           :         front1, 2024-06-03, 3d
    Token management          :         front2, after front1, 2d
    Protected routes          :         front3, after front2, 2d

    section Integration
    API integration           :         int1, after des4, 2d
    E2E testing              :         int2, after int1, 3d
    Security audit           :         int3, after int2, 2d
4. PlantUML Deep Dive: Enterprise Architecture {#plantuml-tutorial}
PlantUML excels at formal UML diagrams and enterprise architecture documentation. Let’s explore practical examples.
Tutorial 1: Component Diagram for E-Commerce Platform
Example Code:
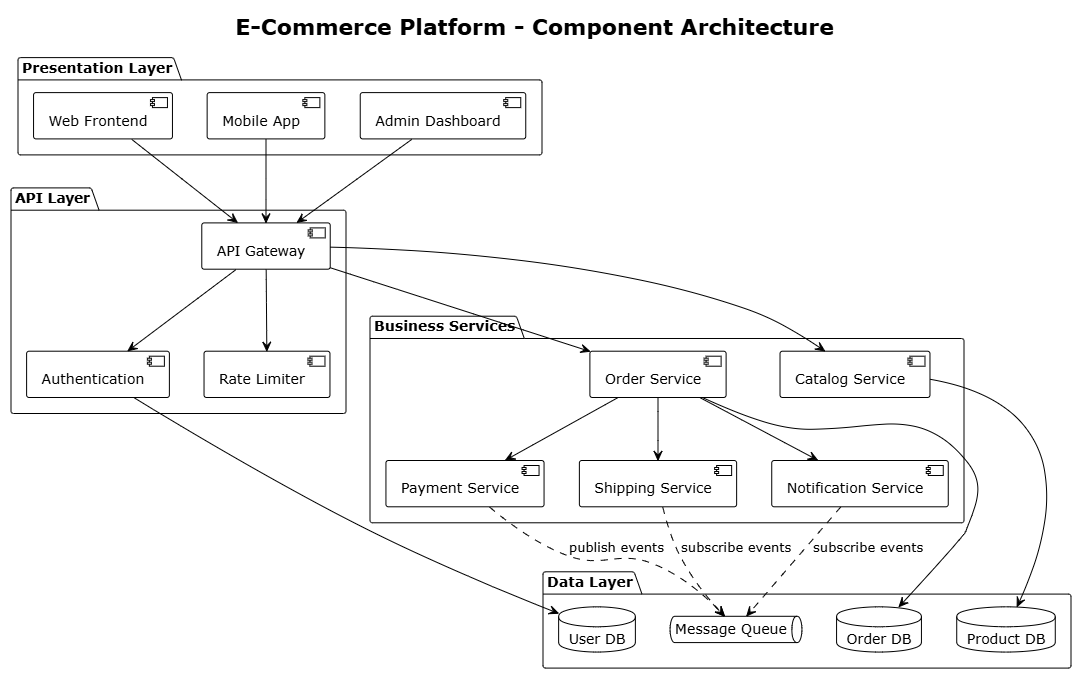
@startuml
!theme plain
skinparam backgroundColor #FFFFFF
skinparam componentStyle uml2

title "E-Commerce Platform - Component Architecture"

package "Presentation Layer" {
    [Web Frontend] as Web
    [Mobile App] as Mobile
    [Admin Dashboard] as Admin
}

package "API Layer" {
    [API Gateway] as Gateway
    [Authentication] as Auth
    [Rate Limiter] as RateLimit
}

package "Business Services" {
    [Catalog Service] as Catalog
    [Order Service] as Order
    [Payment Service] as Payment
    [Shipping Service] as Shipping
    [Notification Service] as Notify
}

package "Data Layer" {
    database "Product DB" as ProdDB
    database "Order DB" as OrderDB
    database "User DB" as UserDB
    queue "Message Queue" as MQ
}

Web --> Gateway
Mobile --> Gateway
Admin --> Gateway

Gateway --> Auth
Gateway --> RateLimit
Gateway --> Catalog
Gateway --> Order

Order --> Payment
Order --> Shipping
Order --> Notify

Catalog --> ProdDB
Order --> OrderDB
Auth --> UserDB

Payment ..> MQ : publish events
Shipping ..> MQ : subscribe events
Notify ..> MQ : subscribe events

@enduml
Figure 3: PlantUML component diagram showing layered architecture
Tutorial 2: Deployment Diagram for Cloud Infrastructure
Example Code:
Tutorial 3: C4 Model – Container Diagram
The C4 Model is excellent for communicating software architecture at multiple levels of abstraction.
Example Code:
@startuml
!define AWS_COLOR FF9900
!define DOCKER_COLOR 0DB7ED
skinparam componentStyle uml2
skinparam backgroundColor #FAFAFA
title “Cloud Deployment Architecture”
package “AWS Region: us-east-1” {
package “Public Subnet” {
[CloudFront CDN] as CDN
[Application Load Balancer] as ALB #AWS_COLOR
}
package “Private Subnet 1” {
[Web Server 1] as Web1 #DOCKER_COLOR
[Web Server 2] as Web2 #DOCKER_COLOR
}
package “Private Subnet 2” {
[API Server 1] as API1 #DOCKER_COLOR
[API Server 2] as API2 #DOCKER_COLOR
}
package “Data Tier” {
database “RDS Primary” as RDS1 #AWS_COLOR
database “RDS Replica” as RDS2 #AWS_COLOR
[ElastiCache Redis] as Cache #AWS_COLOR
}
package “Storage” {
[S3 Bucket] as S3 #AWS_COLOR
[EFS Shared Storage] as EFS #AWS_COLOR
}
}
Internet –> CDN
CDN –> ALB
ALB –> Web1
ALB –> Web2
Web1 –> API1
Web1 –> API2
Web2 –> API1
Web2 –> API2
API1 –> RDS1
API2 –> RDS1
RDS1 -[dashed]> RDS2
API1 –> Cache
API2 –> Cache
API1 –> S3
API2 –> S3
Web1 –> EFS
Web2 –> EFS
@enduml
Tutorial 4: Activity Diagram for Workflow
Example Code:
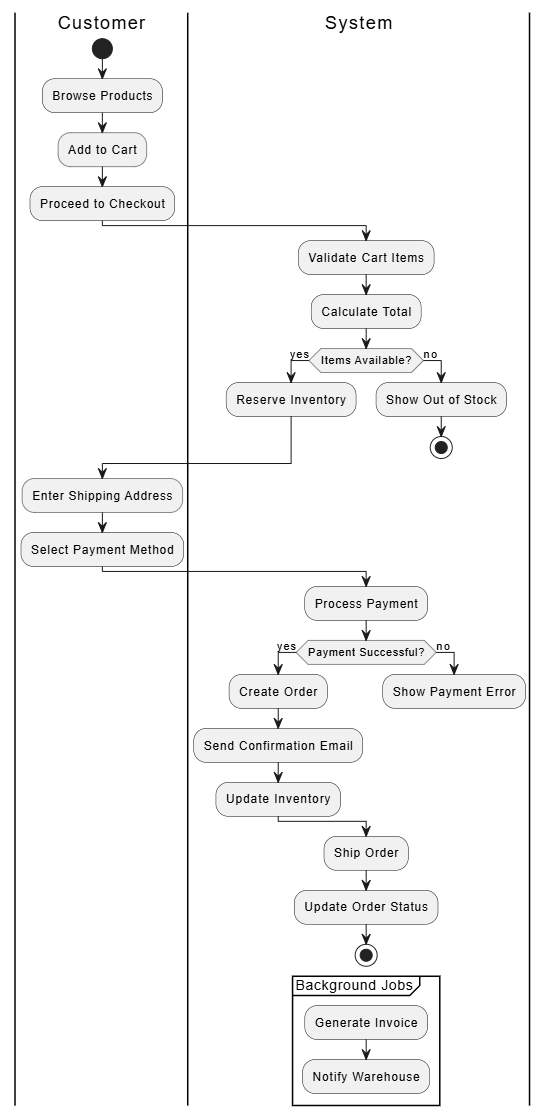
@startuml
|Customer|
start
:Browse Products;
:Add to Cart;
:Proceed to Checkout;

|System|
:Validate Cart Items;
:Calculate Total;
if (Items Available?) then (yes)
  :Reserve Inventory;
else (no)
  :Show Out of Stock;
  stop
endif

|Customer|
:Enter Shipping Address;
:Select Payment Method;

|System|
:Process Payment;
if (Payment Successful?) then (yes)
  :Create Order;
  :Send Confirmation Email;
  :Update Inventory;
else (no)
  :Show Payment Error;
  detach
endif

:Ship Order;
:Update Order Status;
stop

partition "Background Jobs" {
  :Generate Invoice;
  :Notify Warehouse;
}

@enduml
5. Graphviz Fundamentals: Complex Network Visualization {#graphviz-tutorial}
Graphviz (DOT language) excels at visualizing complex relationships and network topologies where layout algorithms matter.
Tutorial 1: Microservices Dependency Graph
Example Code:
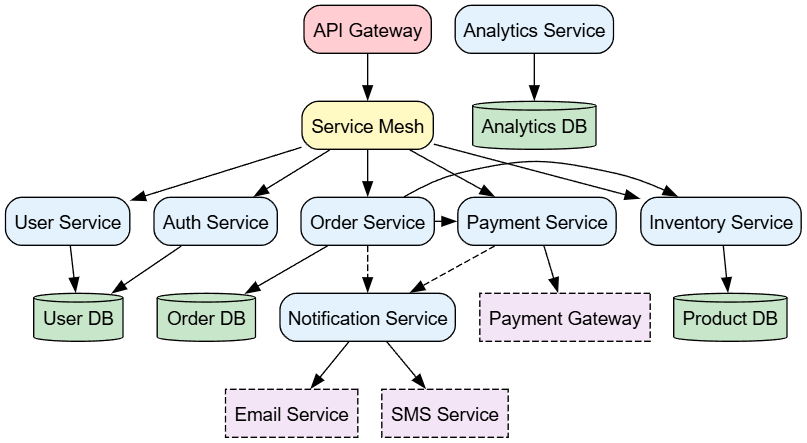
Figure 4: Graphviz visualization showing microservices dependencies and data flow
digraph MicroservicesDependencies {
    rankdir=TB;
    node [shape=box, style="rounded,filled", fontname="Arial"];
    edge [fontname="Arial", fontsize=10];

    // Node definitions with colors
    node [fillcolor="#e3f2fd"];
    "API Gateway" [fillcolor="#ffcdd2"];
    "Service Mesh" [fillcolor="#fff9c4"];

    // Core services
    "User Service";
    "Auth Service";
    "Order Service";
    "Payment Service";
    "Inventory Service";
    "Notification Service";
    "Analytics Service";

    // Databases
    node [shape=cylinder, fillcolor="#c8e6c9"];
    "User DB";
    "Order DB";
    "Product DB";
    "Analytics DB";

    // External services
    node [shape=box, fillcolor="#f3e5f5", style="dashed,filled"];
    "Payment Gateway";
    "Email Service";
    "SMS Service";

    // Relationships
    "API Gateway" -> "Service Mesh";
    "Service Mesh" -> "User Service";
    "Service Mesh" -> "Auth Service";
    "Service Mesh" -> "Order Service";
    "Service Mesh" -> "Payment Service";
    "Service Mesh" -> "Inventory Service";

    "User Service" -> "User DB";
    "Auth Service" -> "User DB";
    "Order Service" -> "Order DB";
    "Order Service" -> "Inventory Service";
    "Order Service" -> "Payment Service";
    "Inventory Service" -> "Product DB";
    "Payment Service" -> "Payment Gateway";
    "Notification Service" -> "Email Service";
    "Notification Service" -> "SMS Service";
    "Analytics Service" -> "Analytics DB";

    "Order Service" -> "Notification Service" [style=dashed];
    "Payment Service" -> "Notification Service" [style=dashed];

    // Subgraphs for grouping
    {
        rank=same;
        "User Service";
        "Auth Service";
    }

    {
        rank=same;
        "Order Service";
        "Payment Service";
        "Inventory Service";
    }
}
Tutorial 2: Organizational Hierarchy
Example Code:
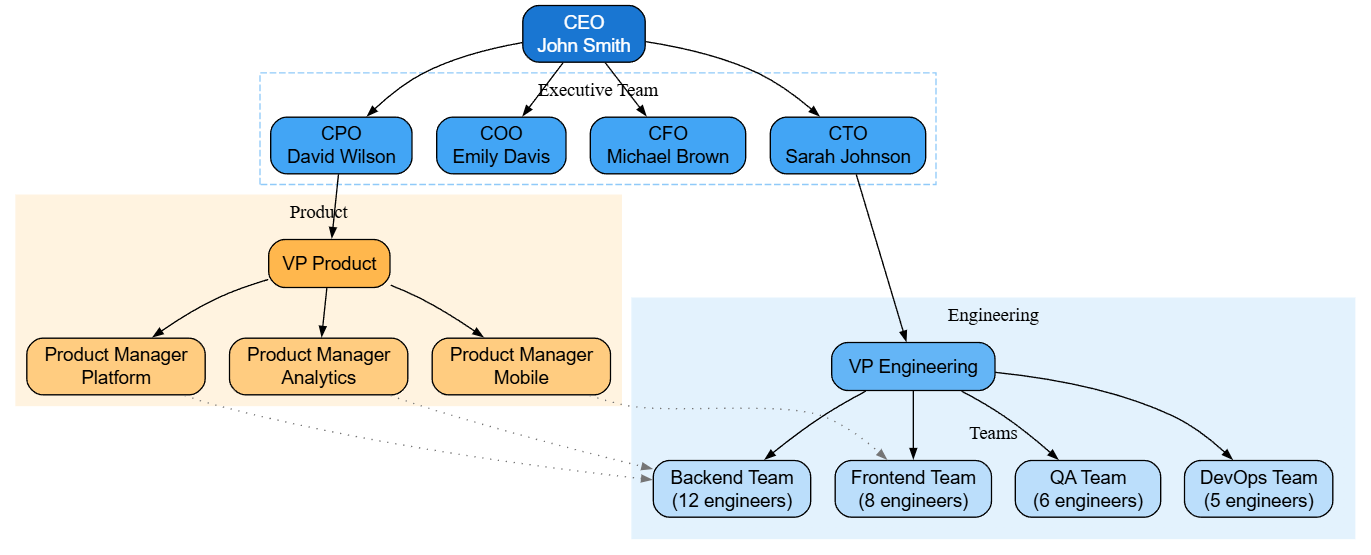
digraph OrgChart {
    rankdir=TB;
    node [shape=box, style="rounded,filled", fontname="Helvetica"];
    edge [fontname="Helvetica", arrowsize=0.7];

    // Executive level
    CEO [label="CEO\nJohn Smith", fillcolor="#1976d2", fontcolor="white"];

    // C-Level
    subgraph cluster_exec {
        label="Executive Team";
        style=dashed;
        color="#90caf9";

        CTO [label="CTO\nSarah Johnson", fillcolor="#42a5f5"];
        CFO [label="CFO\nMichael Brown", fillcolor="#42a5f5"];
        COO [label="COO\nEmily Davis", fillcolor="#42a5f5"];
        CPO [label="CPO\nDavid Wilson", fillcolor="#42a5f5"];
    }

    // Engineering
    subgraph cluster_eng {
        label="Engineering";
        style=filled;
        color="#e3f2fd";

        VP_Eng [label="VP Engineering", fillcolor="#64b5f6"];

        subgraph cluster_eng_teams {
            label="Teams";
            style=dotted;

            Backend [label="Backend Team\n(12 engineers)", fillcolor="#bbdefb"];
            Frontend [label="Frontend Team\n(8 engineers)", fillcolor="#bbdefb"];
            DevOps [label="DevOps Team\n(5 engineers)", fillcolor="#bbdefb"];
            QA [label="QA Team\n(6 engineers)", fillcolor="#bbdefb"];
        }
    }

    // Product
    subgraph cluster_product {
        label="Product";
        style=filled;
        color="#fff3e0";

        VP_Product [label="VP Product", fillcolor="#ffb74d"];
        PM1 [label="Product Manager\nPlatform", fillcolor="#ffcc80"];
        PM2 [label="Product Manager\nMobile", fillcolor="#ffcc80"];
        PM3 [label="Product Manager\nAnalytics", fillcolor="#ffcc80"];
    }

    // Relationships
    CEO -> CTO;
    CEO -> CFO;
    CEO -> COO;
    CEO -> CPO;

    CTO -> VP_Eng;
    VP_Eng -> Backend;
    VP_Eng -> Frontend;
    VP_Eng -> DevOps;
    VP_Eng -> QA;

    CPO -> VP_Product;
    VP_Product -> PM1;
    VP_Product -> PM2;
    VP_Product -> PM3;

    // Dotted lines for collaboration
    PM1 -> Backend [style=dotted, color="#757575"];
    PM2 -> Frontend [style=dotted, color="#757575"];
    PM3 -> Backend [style=dotted, color="#757575"];
}
Tutorial 3: Data Flow Diagram
Example Code:
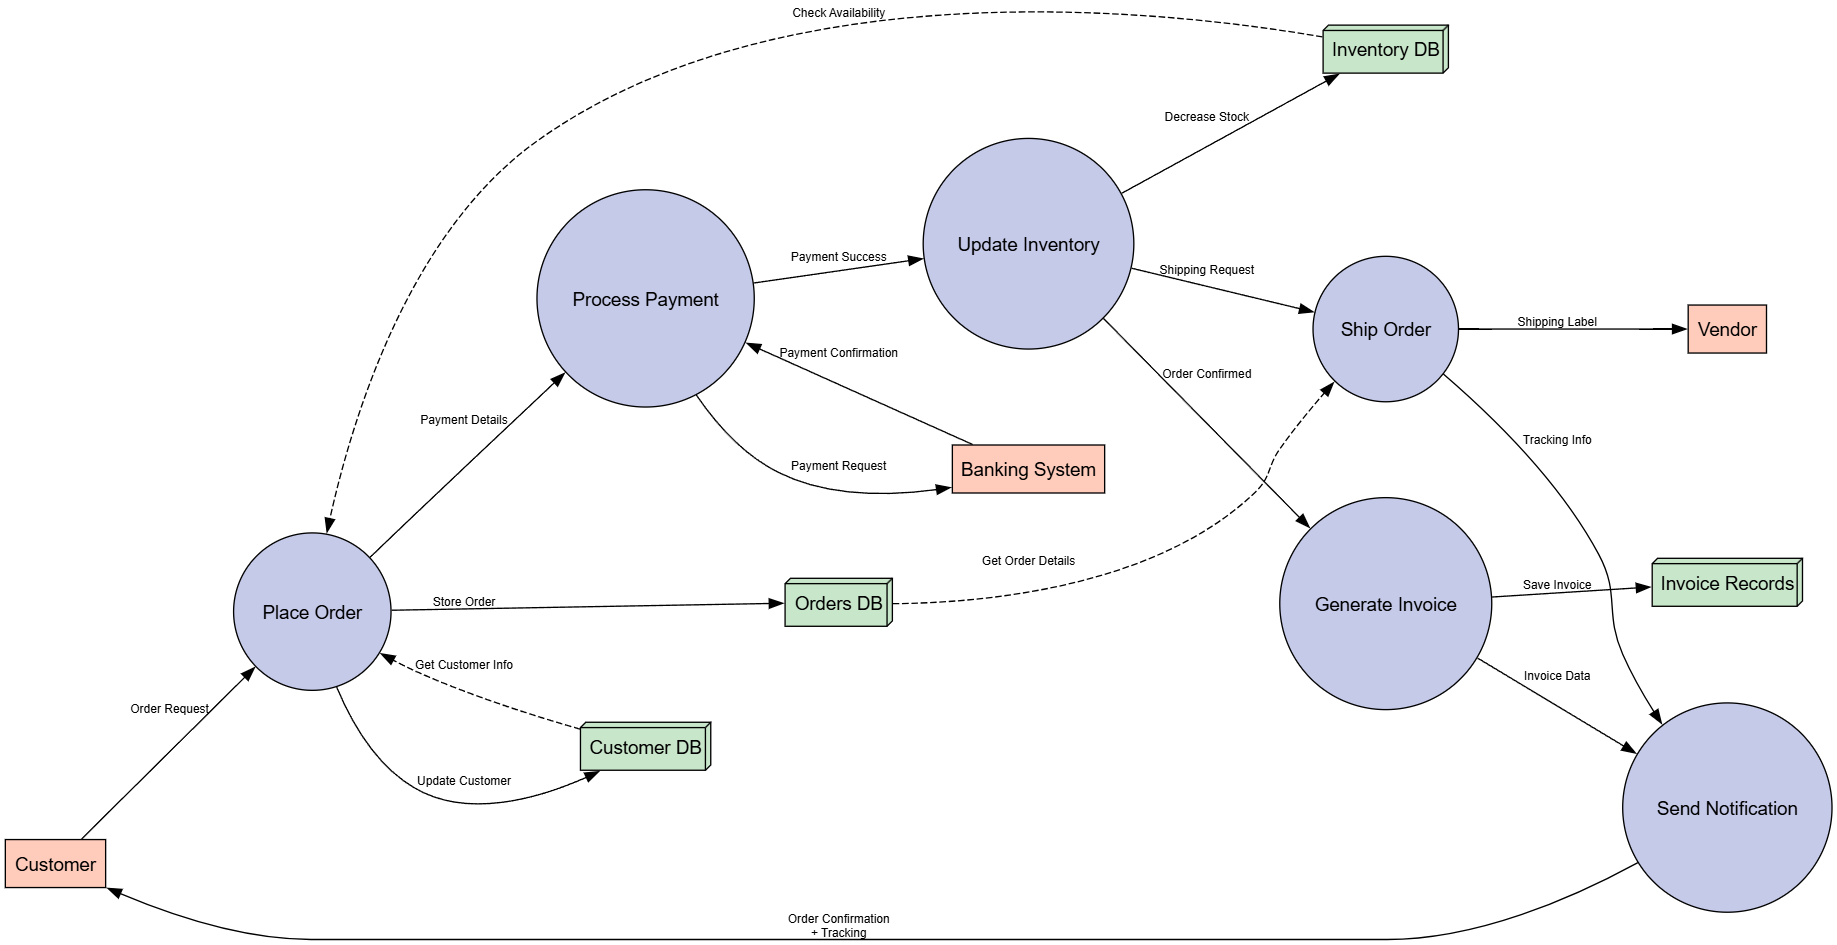
digraph DataFlow {
    rankdir=LR;
    nodesep=1.0;
    node [shape=ellipse, style="filled", fontname="Arial"];
    edge [fontname="Arial", fontsize=9];

    // External entities
    node [fillcolor="#ffccbc", shape=box];
    Customer [label="Customer"];
    Vendor [label="Vendor"];
    Bank [label="Banking System"];

    // Processes
    node [fillcolor="#c5cae9", shape=circle];
    P1 [label="Place Order"];
    P2 [label="Process Payment"];
    P3 [label="Update Inventory"];
    P4 [label="Generate Invoice"];
    P5 [label="Ship Order"];
    P6 [label="Send Notification"];

    // Data stores
    node [fillcolor="#c8e6c9", shape=box3d];
    D1 [label="Orders DB"];
    D2 [label="Inventory DB"];
    D3 [label="Customer DB"];
    D4 [label="Invoice Records"];

    // Data flows
    Customer -> P1 [label="Order Request"];
    P1 -> D1 [label="Store Order"];
    P1 -> D3 [label="Update Customer"];
    P1 -> P2 [label="Payment Details"];

    P2 -> Bank [label="Payment Request"];
    Bank -> P2 [label="Payment Confirmation"];
    P2 -> P3 [label="Payment Success"];

    P3 -> D2 [label="Decrease Stock"];
    P3 -> P4 [label="Order Confirmed"];

    P4 -> D4 [label="Save Invoice"];
    P4 -> P6 [label="Invoice Data"];

    P3 -> P5 [label="Shipping Request"];
    P5 -> Vendor [label="Shipping Label"];
    P5 -> P6 [label="Tracking Info"];

    P6 -> Customer [label="Order Confirmation\n+ Tracking"];

    // Dashed lines for queries
    D1 -> P5 [label="Get Order Details", style=dashed];
    D2 -> P1 [label="Check Availability", style=dashed];
    D3 -> P1 [label="Get Customer Info", style=dashed];
}
6. Real-World Implementation Patterns {#implementation-patterns}
Pattern 1: CI/CD Pipeline Documentation
Example Code (Mermaid):

graph LR
    subgraph Source["Source Control"]
        Git[GitHub Repository]
        PR[Pull Request]
    end

    subgraph CI["Continuous Integration"]
        Lint[Linting]
        Test[Unit Tests]
        Build[Build Artifacts]
        Scan[Security Scan]
    end

    subgraph CD["Continuous Deployment"]
        Dev[Deploy to Dev]
        Stage[Deploy to Staging]
        E2E[E2E Tests]
        Prod[Deploy to Production]
    end

    subgraph Monitor["Monitoring"]
        Logs[Log Aggregation]
        Metrics[Metrics Dashboard]
        Alerts[Alerting System]
    end

    Git --> PR
    PR --> Lint
    Lint --> Test
    Test --> Build
    Build --> Scan
    Scan --> Dev
    Dev --> Stage
    Stage --> E2E
    E2E --> Prod
    Prod --> Logs
    Prod --> Metrics
    Metrics --> Alerts

    style Git fill:#f0f0f0,stroke:#333
    style Prod fill:#d4edda,stroke:#28a745,color:black
    style Alerts fill:#f8d7da,stroke:#dc3545,color:black
Pattern 2: Database Schema Design
Example Code (PlantUML):
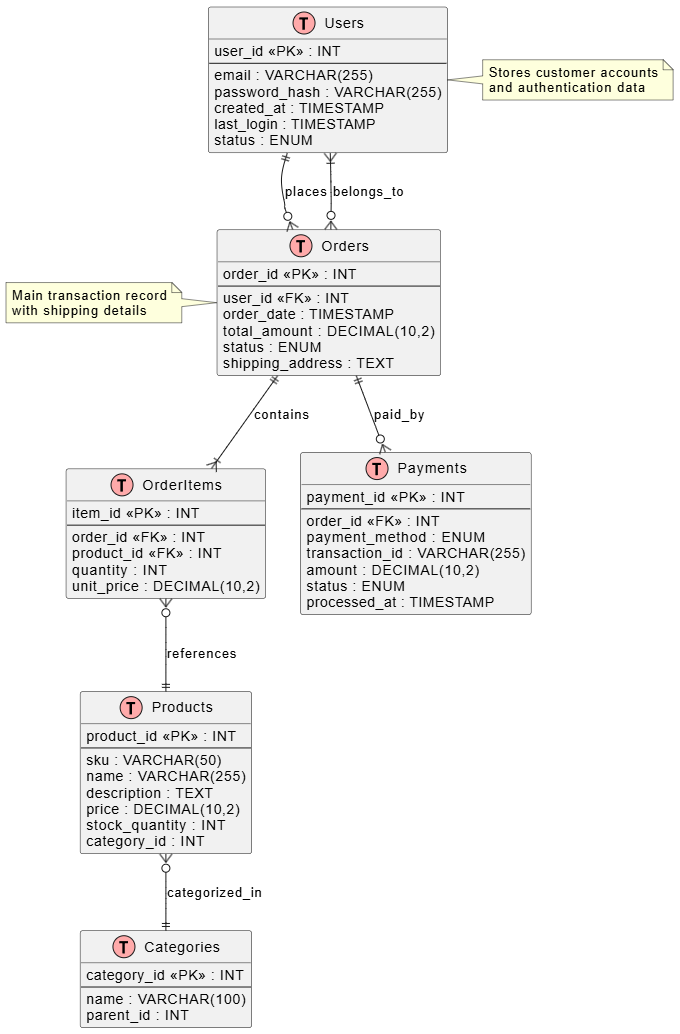
Figure 5: Entity Relationship Diagram showing e-commerce database schema
@startuml
!define TABLE(name) entity name << (T,#FFAAAA) >>
!define PK(x) x <<PK>>
!define FK(x) x <<FK>>

TABLE(Users) {
    PK(user_id) : INT
    --
    email : VARCHAR(255)
    password_hash : VARCHAR(255)
    created_at : TIMESTAMP
    last_login : TIMESTAMP
    status : ENUM
}

TABLE(Products) {
    PK(product_id) : INT
    --
    sku : VARCHAR(50)
    name : VARCHAR(255)
    description : TEXT
    price : DECIMAL(10,2)
    stock_quantity : INT
    category_id : INT
}

TABLE(Categories) {
    PK(category_id) : INT
    --
    name : VARCHAR(100)
    parent_id : INT
}

TABLE(Orders) {
    PK(order_id) : INT
    --
    FK(user_id) : INT
    order_date : TIMESTAMP
    total_amount : DECIMAL(10,2)
    status : ENUM
    shipping_address : TEXT
}

TABLE(OrderItems) {
    PK(item_id) : INT
    --
    FK(order_id) : INT
    FK(product_id) : INT
    quantity : INT
    unit_price : DECIMAL(10,2)
}

TABLE(Payments) {
    PK(payment_id) : INT
    --
    FK(order_id) : INT
    payment_method : ENUM
    transaction_id : VARCHAR(255)
    amount : DECIMAL(10,2)
    status : ENUM
    processed_at : TIMESTAMP
}

Users ||--o{ Orders : places
Orders }o--|{ Users : belongs_to
Orders ||--|{ OrderItems : contains
OrderItems }o--|| Products : references
Products }o--|| Categories : categorized_in
Orders ||--o{ Payments : paid_by

note right of Users
  Stores customer accounts
  and authentication data
end note

note left of Orders
  Main transaction record
  with shipping details
end note

@enduml
Pattern 3: Infrastructure as Code Visualization
Example Code (Mermaid):
graph TB
    subgraph AWS["AWS Cloud Infrastructure"]
        direction TB

        subgraph Networking["Networking"]
            VPC[VPC 10.0.0.0/16]
            IGW[Internet Gateway]
            NAT[NAT Gateway]

            subgraph Public["Public Subnets"]
                ALB[Application Load Balancer]
                Bastion[Bastion Host]
            end

            subgraph Private["Private Subnets"]
                subgraph AppTier["Application Tier"]
                    ECS1[ECS Task 1]
                    ECS2[ECS Task 2]
                    ECS3[ECS Task 3]
                end

                subgraph DataTier["Data Tier"]
                    RDS[RDS PostgreSQL<br/>Multi-AZ]
                    Redis[ElastiCache Redis]
                end
            end
        end

        subgraph Storage["Storage"]
            S3[S3 Buckets<br/>Assets & Backups]
            EFS[EFS Shared Storage]
        end

        subgraph Security["Security"]
            WAF[WAF Rules]
            SG[Security Groups]
            IAM[IAM Roles]
        end

        subgraph Monitoring["Monitoring & Logging"]
            CW[CloudWatch]
            XRay[AWS X-Ray]
            SNS[SNS Notifications]
        end
    end

    User[End Users] --> CloudFront[CloudFront CDN]
    CloudFront --> WAF
    WAF --> ALB
    ALB --> ECS1
    ALB --> ECS2
    ALB --> ECS3

    ECS1 --> RDS
    ECS2 --> RDS
    ECS3 --> RDS

    ECS1 --> Redis
    ECS2 --> Redis
    ECS3 --> Redis

    ECS1 --> S3
    ECS2 --> S3
    ECS3 --> S3

    ECS1 --> EFS
    ECS2 --> EFS
    ECS3 --> EFS

    ECS1 --> CW
    ECS2 --> CW
    ECS3 --> CW

    RDS --> CW
    Redis --> CW

    CW --> SNS

    style VPC fill:#f9f9f9,stroke:#333,stroke-width:2px
    style ALB fill:#ff9900,stroke:#cc7a00,color:white
    style RDS fill:#2e73b8,stroke:#1a4d80,color:white
    style User fill:#95a5a6,stroke:#7f8c8d
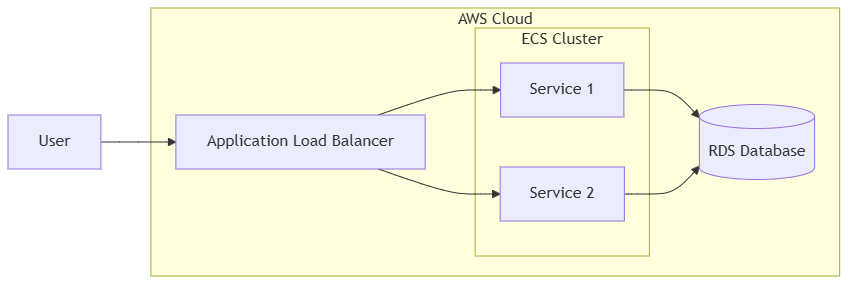
Figure 6: AWS cloud infrastructure architecture diagram
7. Advanced Techniques: Styling and Customization {#advanced-techniques}
Mermaid Advanced Styling
Theme Customization:
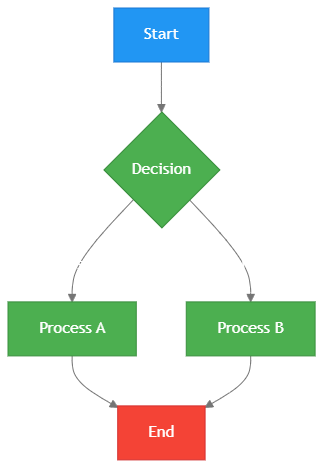
%%{init: {'theme':'base', 'themeVariables': {
    'primaryColor': '#4CAF50',
    'primaryTextColor': '#fff',
    'primaryBorderColor': '#388E3C',
    'lineColor': '#757575',
    'secondaryColor': '#FFC107',
    'tertiaryColor': '#fff'
}}}%%

graph TD
    A[Start] --> B{Decision}
    B -->|Yes| C[Process A]
    B -->|No| D[Process B]
    C --> E[End]
    D --> E

    style A fill:#2196F3,stroke:#1976D2,color:white
    style E fill:#F44336,stroke:#D32F2F,color:white
PlantUML Skin Parameters
Professional Styling:
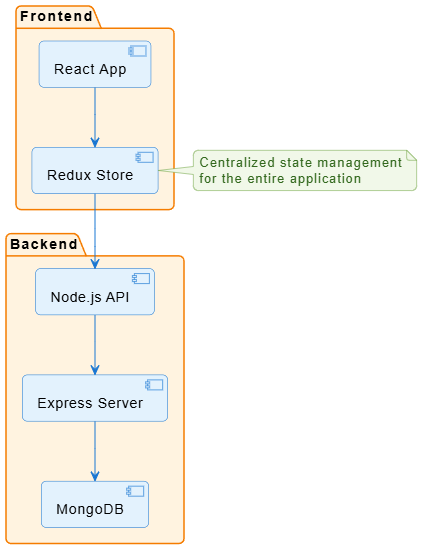
@startuml
' Global styling
skinparam backgroundColor #FFFFFF
skinparam shadowing false
skinparam roundcorner 10
skinparam linetype ortho

' Component styling
skinparam component {
    BackgroundColor #E3F2FD
    BorderColor #1976D2
    ArrowColor #1976D2
}

' Package styling
skinparam package {
    BackgroundColor #FFF3E0
    BorderColor #F57C00
    FontSize 14
}

' Note styling
skinparam note {
    BackgroundColor #F1F8E9
    BorderColor #689F38
    FontColor #33691E
}

package "Frontend" {
    component [React App]
    component [Redux Store]
}

package "Backend" {
    component [Node.js API]
    component [Express Server]
    database [MongoDB]
}

[React App] --> [Redux Store]
[Redux Store] --> [Node.js API]
[Node.js API] --> [Express Server]
[Express Server] --> [MongoDB]

note right of [Redux Store]
  Centralized state management
  for the entire application
end note

@enduml
Graphviz Advanced Attributes
Professional Network Diagram:
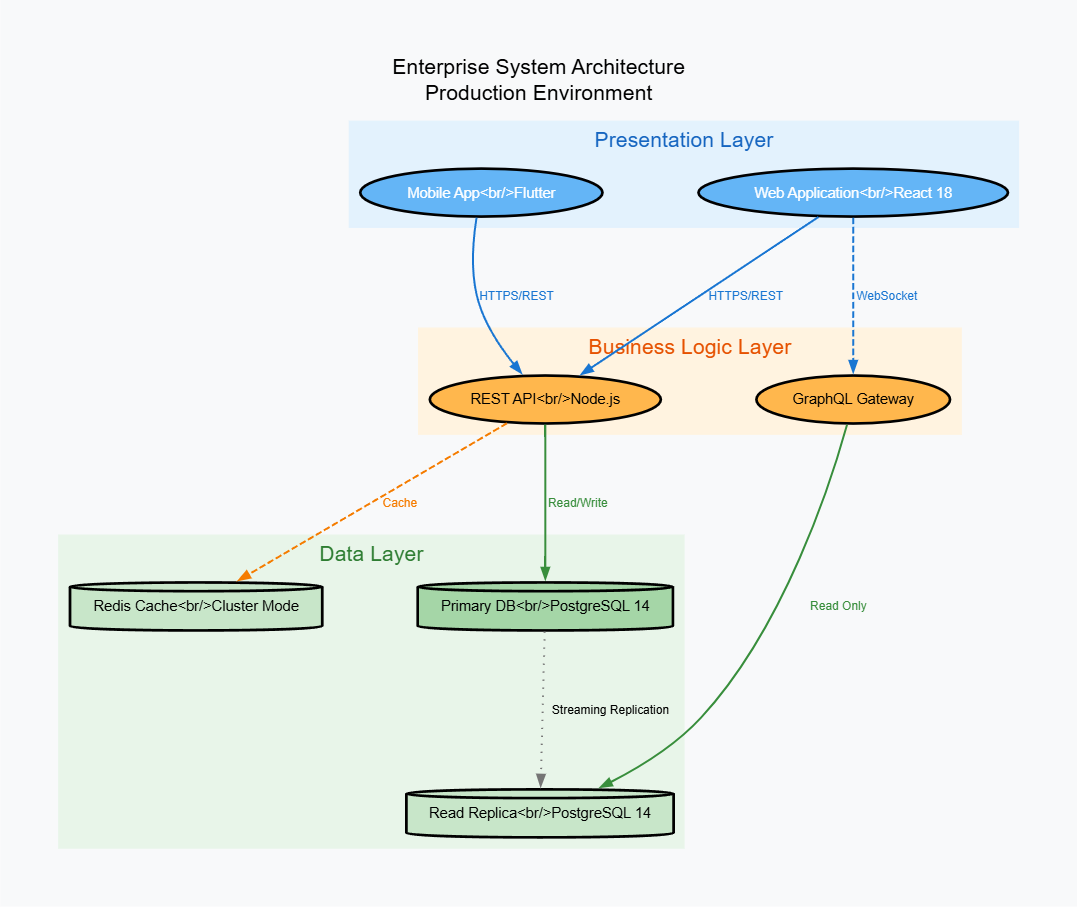
digraph AdvancedStyling {
    // Global graph attributes
    graph [
        bgcolor="#f8f9fa"
        fontname="Helvetica"
        fontsize=16
        label="Enterprise System Architecture\nProduction Environment"
        labelloc="t"
        pad=0.5
        ranksep=1.5
        nodesep=1.0
    ];

    // Default node attributes
    node [
        fontname="Helvetica"
        fontsize=11
        style="filled,rounded"
        penwidth=2
    ];

    // Default edge attributes
    edge [
        fontname="Helvetica"
        fontsize=9
        penwidth=1.5
        arrowsize=0.8
    ];

    // Node clusters with custom styling
    subgraph cluster_presentation {
        label="Presentation Layer";
        style=filled;
        color="#e3f2fd";
        fontcolor="#1565c0";

        Web [label="Web Application<br/>React 18", fillcolor="#64b5f6", fontcolor="white"];
        Mobile [label="Mobile App<br/>Flutter", fillcolor="#64b5f6", fontcolor="white"];
    }

    subgraph cluster_business {
        label="Business Logic Layer";
        style=filled;
        color="#fff3e0";
        fontcolor="#e65100";

        API [label="REST API<br/>Node.js", fillcolor="#ffb74d", fontcolor="black"];
        GraphQL [label="GraphQL Gateway", fillcolor="#ffb74d", fontcolor="black"];
    }

    subgraph cluster_data {
        label="Data Layer";
        style=filled;
        color="#e8f5e9";
        fontcolor="#2e7d32";

        Primary [label="Primary DB<br/>PostgreSQL 14", shape=cylinder, fillcolor="#a5d6a7"];
        Replica [label="Read Replica<br/>PostgreSQL 14", shape=cylinder, fillcolor="#c8e6c9"];
        Cache [label="Redis Cache<br/>Cluster Mode", shape=cylinder, fillcolor="#c8e6c9"];
    }

    // Edges with custom styling
    Web -> API [label="HTTPS/REST", color="#1976d2", fontcolor="#1976d2"];
    Mobile -> API [label="HTTPS/REST", color="#1976d2", fontcolor="#1976d2"];
    Web -> GraphQL [label="WebSocket", color="#1976d2", fontcolor="#1976d2", style=dashed];

    API -> Primary [label="Read/Write", color="#388e3c", fontcolor="#388e3c"];
    API -> Cache [label="Cache", color="#f57c00", fontcolor="#f57c00", style=dashed];
    GraphQL -> Replica [label="Read Only", color="#388e3c", fontcolor="#388e3c"];

    Primary -> Replica [label="Streaming Replication", color="#757575", style=dotted];
}
8. Collaboration and Sharing Workflows {#collaboration}
Creating Shareable Diagrams
Step-by-Step Sharing:
-
Generate Share Link:
-
Click the “Share” button in VPasCode
-
Copy the generated URL
-
Share via email, Slack, or documentation
-
-
Embed in Documentation:
## System Architecture  Or embed the interactive version: <iframe src="https://www.vpascode.com/embed/abc123xyz" width="100%" height="600"></iframe> -
Export for Presentations:
-
SVG for scalable web graphics
-
PNG (300 DPI) for PowerPoint/Keynote
-
PDF for print documentation
-
Version Control Integration
Store Diagram Code in Git:
project-root/
├── docs/
│   ├── diagrams/
│   │   ├── architecture/
│   │   │   ├── system-overview.puml
│   │   │   ├── deployment-view.puml
│   │   │   └── data-flow.mmd
│   │   ├── processes/
│   │   │   └── user-journey.mmd
│   │   └── infrastructure/
│   │       └── aws-architecture.dot
│   └── README.md
└── src/
Example Git Workflow:
# Create diagram
echo '@startuml
component "API Gateway"
@enduml' > docs/diagrams/architecture/gateway.puml

# Commit changes
git add docs/diagrams/architecture/gateway.puml
git commit -m "Add API Gateway architecture diagram"
git push

# Team members can now view in VPasCode
# by pasting the code or loading from URL
Team Collaboration Patterns
Pattern 1: Architecture Decision Records (ADRs)
# ADR-007: Microservices Communication Pattern

## Context
We need to standardize how microservices communicate.

## Decision
Use asynchronous messaging via RabbitMQ for inter-service communication.

## Architecture Diagram

```mermaid
graph LR
    A[Service A] -->|Publish| B[(RabbitMQ)]
    B -->|Subscribe| C[Service B]
    B -->|Subscribe| D[Service C]
Consequences
-
Improved decoupling
-
Better scalability
-
Added complexity in message handling
**Pattern 2: Sprint Planning Documentation**

Create living diagrams that evolve with your sprint:
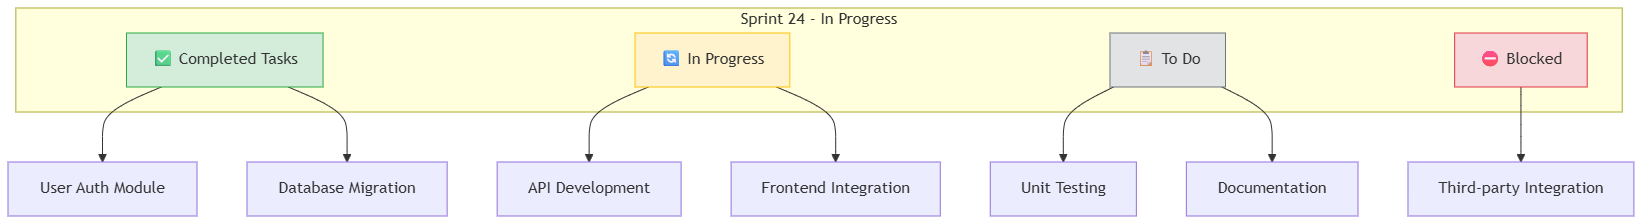
graph TD
    subgraph Sprint24["Sprint 24 - In Progress"]
        Done[✅ Completed Tasks]
        InProgress[🔄 In Progress]
        ToDo[📋 To Do]
        Blocked[⛔ Blocked]
    end

    Done --> Task1[User Auth Module]
    Done --> Task2[Database Migration]

    InProgress --> Task3[API Development]
    InProgress --> Task4[Frontend Integration]

    ToDo --> Task5[Unit Testing]
    ToDo --> Task6[Documentation]

    Blocked --> Task7[Third-party Integration]

    style Done fill:#d4edda,stroke:#28a745
    style InProgress fill:#fff3cd,stroke:#ffc107
    style ToDo fill:#e2e3e5,stroke:#6c757d
    style Blocked fill:#f8d7da,stroke:#dc3545
Conclusion: Your Journey to Documentation Excellence
Congratulations! You’ve now completed a comprehensive journey through VPasCode and the Diagram-as-Code methodology. Let’s reflect on what you’ve learned and chart your path forward.
What You’ve Mastered
Throughout this tutorial, you’ve discovered:
-
The Power of Text-Based Diagrams: You’ve seen how writing code to create diagrams eliminates the friction of manual positioning, ensures consistency, and makes documentation maintainable.
-
Three Industry-Standard Engines: You now have practical skills in:
-
Mermaid.js for developer-friendly flowcharts and modern documentation
-
PlantUML for enterprise-grade UML and architecture diagrams
-
Graphviz for complex network topologies and relationship visualizations
-
-
Real-World Patterns: From microservices architecture to database schemas, CI/CD pipelines to organizational charts—you’ve learned to visualize virtually any system or process.
-
Collaboration Workflows: You understand how to share diagrams via URLs, embed them in documentation, integrate with version control, and automate generation in CI/CD pipelines.
-
Professional Styling: You can create publication-quality visuals with custom themes, consistent branding, and appropriate detail levels for different audiences.
The Bigger Picture
What makes VPasCode truly transformative isn’t just the tool itself—it’s the paradigm shift it represents. By treating diagrams as code, you’re:
-
Bridging the gap between implementation and documentation
-
Democratizing architecture by making it accessible to everyone on the team
-
Future-proofing knowledge through text-based, version-controlled artifacts
-
Accelerating onboarding with clear, executable documentation
-
Reducing technical debt by making updates as simple as editing text
Your Next Steps
Week 1: Start Small
-
Pick one existing diagram in your organization
-
Recreate it in VPasCode using your preferred engine
-
Share it with a colleague and gather feedback
-
Store the code in your project repository
Week 2-3: Build Momentum
-
Create templates for your team’s common diagram types
-
Establish naming conventions and style guidelines
-
Integrate diagram reviews into your code review process
-
Document your “Diagram-as-Code” workflow
Month 2: Scale and Automate
-
Set up CI/CD integration for automatic diagram generation
-
Create a diagram library for your organization
-
Train team members on the workflow
-
Measure time saved and documentation quality improvements
Month 3+: Make It Cultural
-
Advocate for diagram-as-code in architecture decisions
-
Share success stories with leadership
-
Contribute templates back to the community
-
Explore advanced features like AI-assisted diagram generation
The Competitive Advantage
Organizations that master Diagram-as-Code gain significant advantages:
✅ Faster Decision-Making: Clear visuals accelerate understanding and alignment
✅ Reduced Onboarding Time: New engineers grasp systems faster through executable documentation
✅ Better Stakeholder Communication: Professional diagrams bridge technical and business perspectives
✅ Lower Maintenance Burden: Updating text is faster than redrawing visuals
✅ Improved Code Quality: The act of diagramming reveals architectural issues early
Join the Movement
You’re now part of a growing community of developers, architects, and teams who recognize that documentation doesn’t have to be a burden. With VPasCode, you have the tools to make it an asset—a living, breathing representation of your system that evolves alongside your code.
Final Thought
The best time to start treating diagrams as code was yesterday. The second-best time is now.
Your future self—and your future teammates—will thank you for the clarity, consistency, and confidence that comes from documentation that’s always current, always accessible, and always accurate.
Ready to begin? Visit VPasCode right now, paste in your first diagram code, and watch as text transforms into clarity. In less time than it took to read this conclusion, you’ll have created your first Diagram-as-Code artifact.
The future of technical documentation is here. It’s code-driven, browser-based, and completely free. Welcome to the revolution.
About This Tutorial
This comprehensive guide was created to help development teams modernize their documentation practices through Diagram-as-Code. Built on the foundation of Visual Paradigm’s two decades of enterprise architecture expertise, VPasCode represents the future of technical communication—accessible, maintainable, and free.
Last Updated: June 2026
Target Audience: Software developers, system architects, DevOps engineers, technical writers, and development teams
Prerequisites: Basic understanding of software architecture concepts
Estimated Completion Time: 2-3 hours for full tutorial, 15 minutes for quick start
Happy Diagramming! 🎨📊