


Introduction: Why Activity Diagrams Matter in Modern System Design
As someone who has navigated the complexities of software architecture and business process modeling for years, I’ve come to appreciate one truth: clarity is everything. In a world where stakeholders speak different languages—developers, business analysts, project managers—visual modeling becomes the universal translator. Among the UML diagram family, Activity Diagrams have consistently proven to be one of the most practical tools for mapping workflows, uncovering bottlenecks, and aligning teams around shared understanding.

Recently, I had the opportunity to explore Visual Paradigm’s comprehensive approach to creating Activity Diagrams—from traditional manual methods to their groundbreaking AI-powered generation tools. What follows is my detailed, experience-based guide to understanding, creating, and leveraging Activity Diagrams effectively, with a special focus on how modern AI tools are transforming this essential practice.
What is an Activity Diagram?
Activity diagrams stand out as one of the most intuitive behavioral diagrams in the Unified Modeling Language (UML) ecosystem. At its core, an Activity Diagram is essentially an advanced, UML-compliant flowchart that models the dynamic flow from one activity to another within a system.

What makes Activity Diagrams particularly valuable is their ability to represent both sequential and parallel processes, decision points, and object flows—all within a single, readable visual framework. Unlike basic flowcharts, Activity Diagrams incorporate UML semantics that make them suitable for rigorous system design, requirements validation, and documentation that scales with project complexity.
When to Use Activity Diagrams: Practical Guidance from the Field
Through my experience working with cross-functional teams, I’ve identified several scenarios where Activity Diagrams deliver exceptional value:
-
Coordinating complex operations: When a single use case involves multiple overlapping activities that require precise sequencing or parallel execution
-
Mapping business workflows: Visualizing how different departments or actors collaborate to deliver a service end-to-end
-
Identifying candidate use cases: Examining business processes to discover potential system requirements
-
Defining context boundaries: Clarifying pre-conditions and post-conditions for specific operations
-
Modeling intricate logic: Breaking down complex decision trees, conditional branches, and exception handling paths
-
Documenting high-level processes: Creating executive-friendly overviews that can be progressively detailed
The beauty of Activity Diagrams lies in their scalability. You can start with a high-level workflow for stakeholder alignment, then drill down into detailed operational steps for development teams—all within the same modeling framework.
Activity Diagrams in Action: Learn Through Real-World Examples
A Basic Activity Diagram: The Foundation
Before diving into complex scenarios, it helps to understand the fundamentals. Here’s a simple, flowchart-style Activity Diagram that demonstrates core notation:

This example shows the essential elements: start node, actions, decision points, and end node. It’s the perfect starting point for beginners.
Modeling a Word Processor Workflow
One of my favorite teaching examples is modeling a document creation workflow. This Activity Diagram walks through the complete process:
-
Open the word processing package
-
Create a new file
-
Save with a unique name
-
Type content
-
Conditionally add graphics or spreadsheets
-
Save final version
-
Print hard copy
-
Exit application
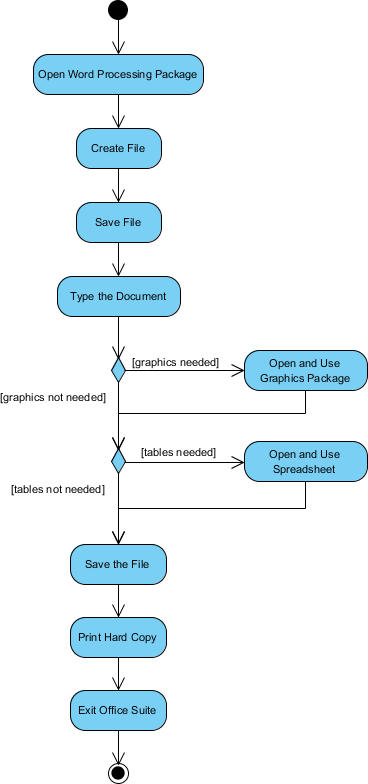
What I appreciate about this example is how it demonstrates conditional logic (the diamond-shaped decision node) and optional parallel paths—real-world complexity made visually digestible.
Process Order: Handling Parallel Workflows
Business processes often involve concurrent activities. Consider an order fulfillment system where billing and shipping happen simultaneously:
“Once the order is received, the activities split into two parallel sets. One side fills and sends the order while the other handles billing. On the Fill Order side, delivery method is decided conditionally. Finally, parallel activities combine to close the order.”
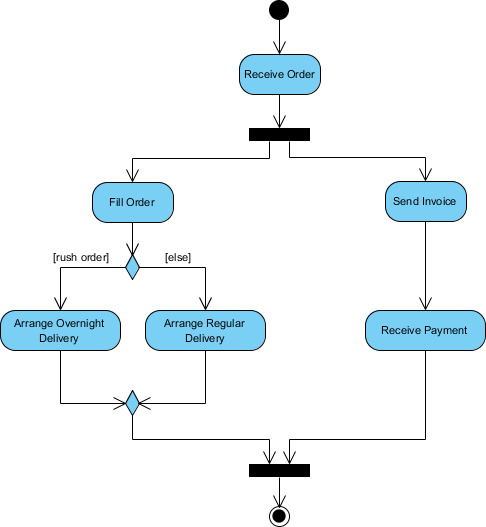
This diagram elegantly uses Fork and Join nodes to represent parallel execution—a pattern I’ve found invaluable when modeling microservices architectures or distributed systems.
Student Enrollment: Multi-Actor Coordination
University enrollment processes involve multiple stakeholders and sequential dependencies. This Activity Diagram captures the journey from application to seminar registration:

What stands out here is the clear handoff between applicant and registrar, with decision points ensuring data quality before proceeding. It’s a textbook example of using Activity Diagrams for service design.
Enhancing Clarity with Swimlanes
When workflows involve multiple actors, departments, or system components, Swimlanes become indispensable. They partition the diagram vertically or horizontally to show “who does what.”
Swimlane Example: Staff Expenses Submission

In this expenses workflow, each swimlane represents a distinct role (Employee, Manager, Finance), making accountability and process boundaries immediately visible.
Before and After: The Swimlane Difference
To truly appreciate the value of Swimlanes, compare these two representations of a client onboarding process:
Without Swimlanes:

With Swimlanes:

The swimlane version instantly clarifies responsibilities. In stakeholder reviews, I’ve found this visual organization reduces confusion and accelerates consensus.
Activity Diagram Notation: Your Visual Vocabulary
Mastering Activity Diagrams means understanding their symbolic language. Here’s a comprehensive reference:
| Notation Description | UML Notation |
|---|---|
| Activity: Represents a set of actions |  |
| Action: A single task to be performed |  |
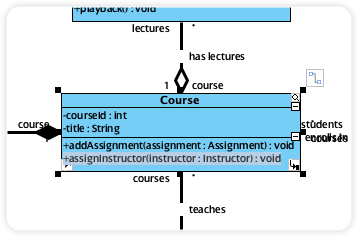
| Control Flow: Shows execution sequence |  |
| Object Flow: Shows data/object movement between activities |  |
| Initial Node: Marks the start point |  |
| Activity Final Node: Terminates all flows |  |
| Object Node: Represents an object in the flow |  |
| Decision Node: Branches based on conditions |  |
| Merge Node: Converges alternative paths |  |
| Fork Node: Splits into parallel flows |  |
| Join Node: Synchronizes parallel flows |  |
| Swimlane/Partition: Groups activities by actor or thread |  |
Keeping this reference handy has saved me countless hours during diagram reviews and team onboarding sessions.
The AI Revolution: Creating Activity Diagrams with Visual Paradigm
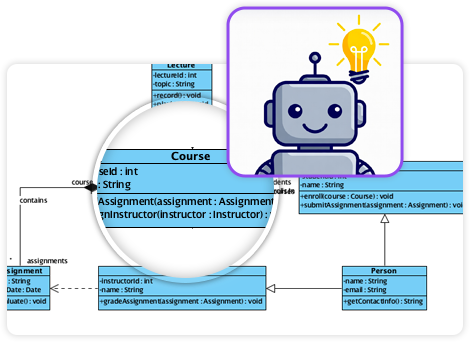
Smarter Diagrams, Powered by AI
What truly excited me during my exploration was Visual Paradigm’s integration of AI into the diagramming workflow. Their promise: “Describe what you need, and our AI builds it for you—perfectly laid out, beautifully designed, and ready to refine.”

The value proposition is compelling: instead of manually dragging shapes and aligning connectors, you describe your workflow in plain language, and the AI generates a standards-compliant UML diagram.
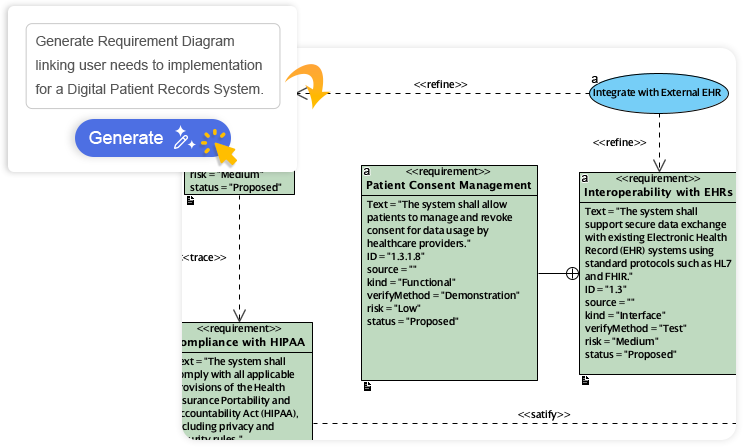
Context-Aware Intelligence
What impressed me most was the AI’s ability to understand intent:
The system doesn’t just place shapes—it interprets relationships, suggests missing elements, and maintains UML semantics. And crucially, everything remains fully editable, so you retain complete control.
Introducing the AI Activity Diagram Generator: From Use Case to Visual Model
Solving the Manual Diagramming Bottleneck
Let’s be honest: manually translating textual requirements into UML diagrams is tedious. I’ve spent hours reading use case documents, dragging shapes, connecting flows, and double-checking that every exception path was represented. It’s slow, error-prone, and distracts from the real work: analyzing requirements.
Visual Paradigm’s new Use Case to Activity Diagram tool addresses this head-on. By providing your use case text, the AI analyzes process flows, actors, and conditions to generate a complete UML Activity Diagram instantly.

Tangible Benefits I’ve Observed
-
Instant visualization: Convert detailed use cases into clear diagrams in seconds, not hours
-
Real-time collaboration: Generate diagrams during stakeholder meetings for immediate feedback
-
Reduced ambiguity: Ensure consistent translation from text to visual model
-
Automated documentation: Receive AI-generated summary reports ready for sharing
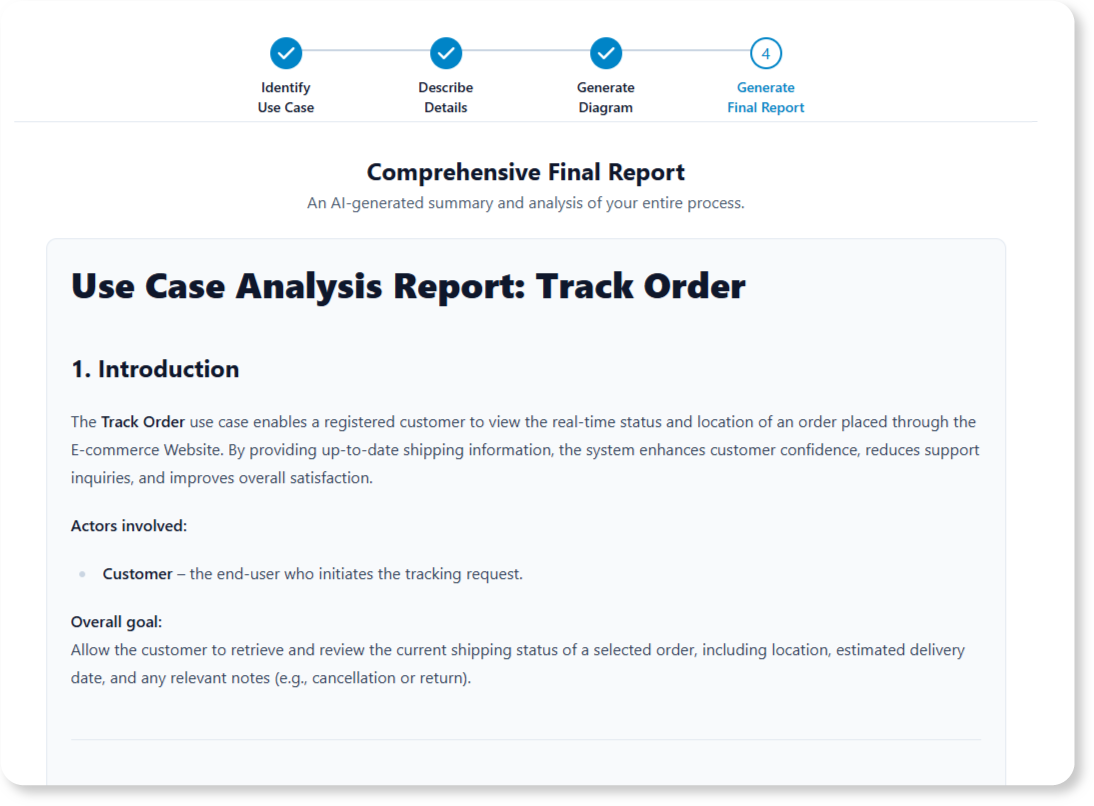
Getting Started: A Four-Step Workflow
Access varies by product:
-
Visual Paradigm Online (Combo Edition+): Visit the app page
-
Visual Paradigm Desktop (Professional Edition+ with maintenance): Navigate to Tools > App > “Use Case to Activity Diagram”
Once launched, the intuitive workflow guides you:
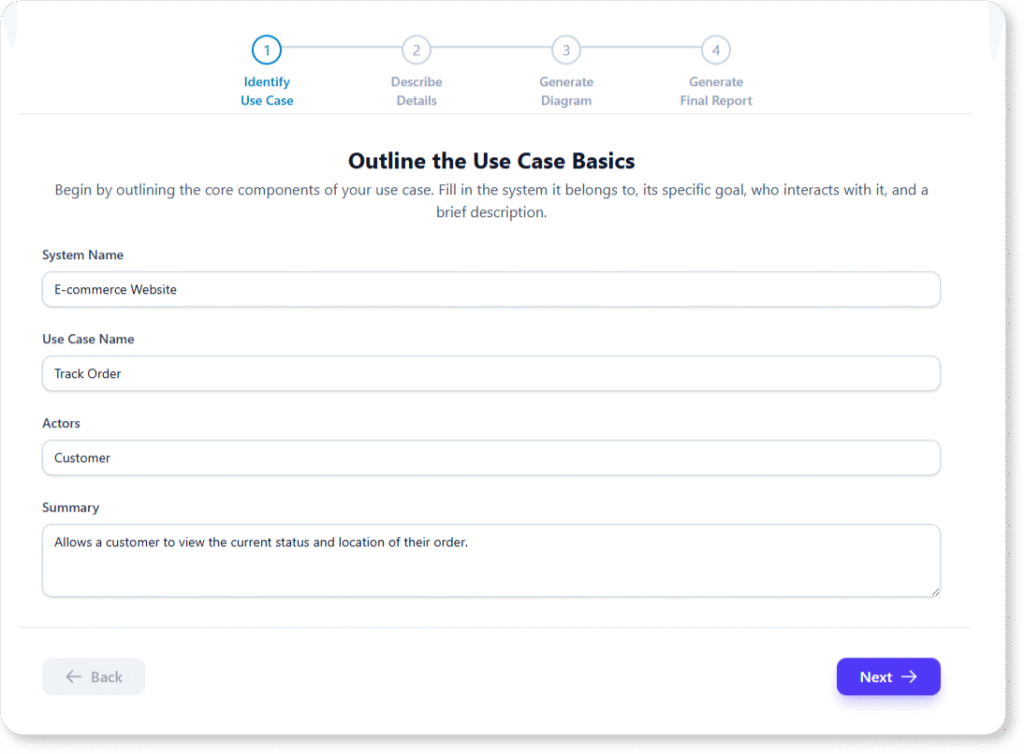
Step 1: Identify Use Case
Outline system, actors, and summary.
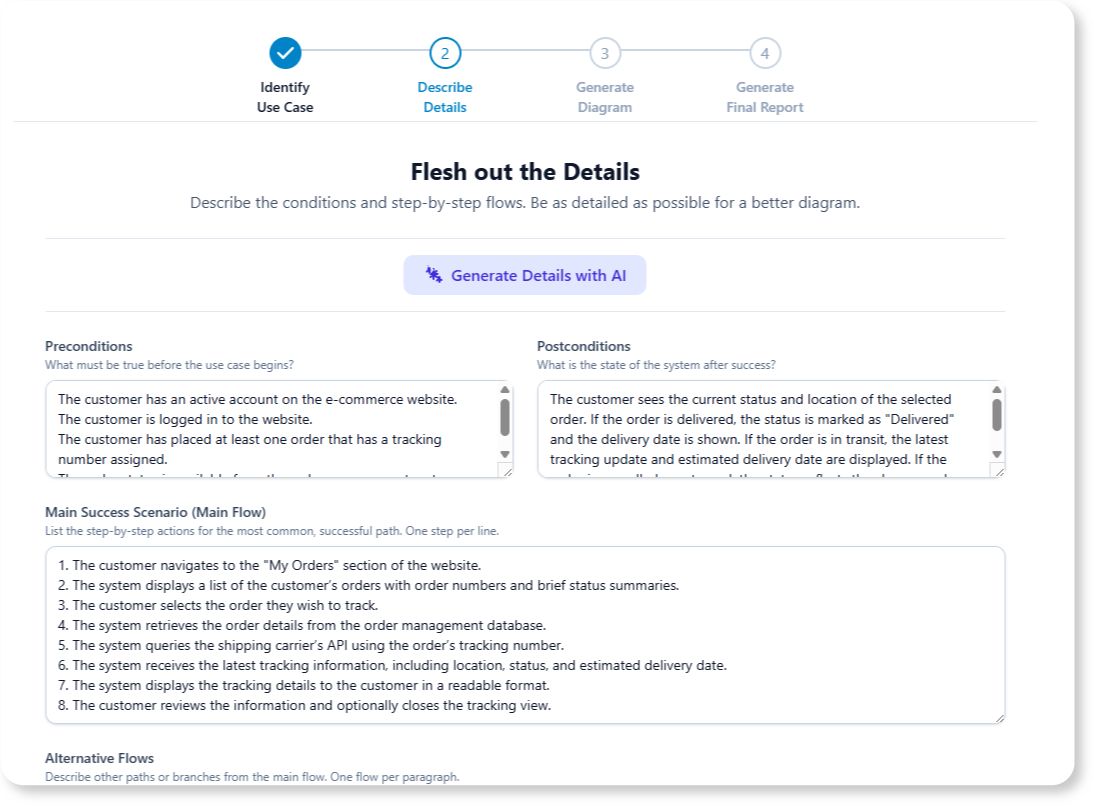
Step 2: Describe Details
Add preconditions, postconditions, main flow, alternatives, and exceptions.
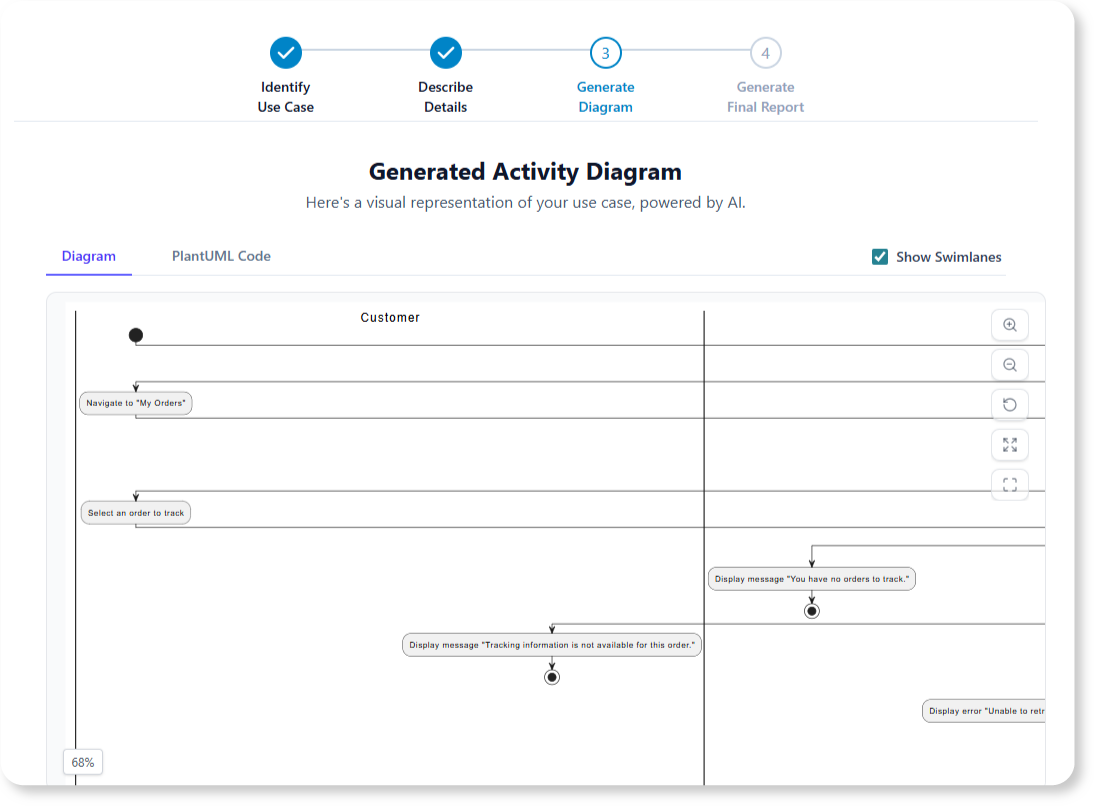
Step 3: Generate Diagram
Let the AI create your UML Activity Diagram.
Step 4: Generate Final Report
Consolidate everything into a professional, shareable summary.
Multiple Paths to Creation: Choosing Your Approach
Visual Paradigm offers flexible methods for creating Activity Diagrams, accommodating different workflows and skill levels:
Manual Drawing (Full Control)
-
Select Diagram > New > Activity Diagram
-
Use the palette to drag-and-drop elements
-
Leverage the Resource Catalog for intelligent shape connections
AI-Powered Generation (Speed & Intelligence)
-
Text Descriptions: Use the AI Chatbot (Tools > Chatbot) to describe workflows in plain English
-
Use Case Scenarios: The dedicated app converts textual use cases into structured diagrams
Synchronization from Existing Models
-
User Stories: Sync scenarios directly to Activity Diagrams
-
Existing Diagrams: Generate scenario documentation from completed models
Template-Based Creation (Quick Start)
Visual Paradigm Online offers industry-specific templates (E-commerce, registration, etc.) for rapid customization.
My Recommendation
For greenfield projects with clear requirements, start with AI generation to accelerate initial modeling. For complex, highly customized workflows, begin manually or refine AI output. The flexibility to switch between approaches is a significant advantage.
Key Features to Leverage
When building your diagrams, these elements consistently deliver the most value:
-
Swimlanes: Map activities to specific actors, roles, or departments for clear accountability
-
Control Nodes: Use Decision Nodes for branching logic; Fork/Join for parallel execution
-
Object Flows: Visualize how data or objects move between activities, clarifying dependencies
-
Hierarchical Decomposition: Start high-level, then drill into sub-activities for detailed design
Pro tip: I always review diagrams with both technical and non-technical stakeholders. The visual nature of Activity Diagrams makes them excellent communication tools across disciplines.
Conclusion: Elevating Your Modeling Practice
After thoroughly exploring Activity Diagrams and Visual Paradigm’s tooling ecosystem, my conclusion is clear: Activity Diagrams remain one of the most practical, versatile tools in the UML toolkit—and modern AI integration is making them more accessible than ever.
Whether you’re a business analyst mapping enterprise workflows, a developer designing system interactions, or a product manager aligning stakeholders, Activity Diagrams provide the visual clarity needed to turn complex processes into shared understanding. The addition of AI-powered generation doesn’t replace human expertise; it amplifies it, freeing you to focus on analysis, validation, and innovation rather than manual diagram construction.
My advice? Start simple. Model a familiar process using basic notation. Gradually incorporate swimlanes, parallel flows, and object interactions. Then, experiment with AI generation to see how it can accelerate your workflow. The investment in learning Activity Diagrams pays dividends in clearer requirements, fewer misunderstandings, and more successful project outcomes.
In an era where complexity is the norm, the ability to visualize, communicate, and refine workflows isn’t just valuable—it’s essential. Activity Diagrams, especially when powered by intelligent tools, give you that capability.
References
- Visual Paradigm User Guide: Drawing Activity Diagrams: Step-by-step instructions for manually creating Activity Diagrams using Visual Paradigm’s drag-and-drop interface and resource catalog.
- Use Case to Activity Diagram Feature Page: Official overview of Visual Paradigm’s AI-powered tool that converts textual use cases into UML Activity Diagrams instantly.
- What is an Activity Diagram? – Visual Paradigm Guide: Comprehensive introduction to Activity Diagrams, including notation, use cases, and practical examples.
- Visual Paradigm Online Tour: Overview of Visual Paradigm Online’s web-based diagramming capabilities, including export options and collaboration features.
- How to Draw Activity Diagrams in UML – Tutorial: Beginner-friendly tutorial covering fundamental concepts and step-by-step diagram creation.
- Activity Diagram Tutorial (Legacy Documentation): Archived tutorial providing foundational knowledge on Activity Diagram modeling techniques.
- Visual Paradigm Desktop AI Activity Diagram Generation Release Notes: Technical details on the AI-powered diagram generation feature for desktop users.
- YouTube: Activity Diagram Tutorial: Video walkthrough demonstrating Activity Diagram creation and best practices.
- Import AI Activity Diagrams into Visual Paradigm Desktop: Guide for importing AI-generated diagrams into desktop projects.
- Blog: Generate Activity Diagrams from Use Cases Instantly: Announcement and use cases for the AI-powered Use Case to Activity Diagram feature.
- User Story to Activity Diagram Tutorial: Instructions for synchronizing agile user stories with Activity Diagrams.
- Beginner’s Guide to Activity Diagrams with Visual Paradigm Online: Entry-level guide for new users of Visual Paradigm Online.
- YouTube: Advanced Activity Diagram Techniques: Video covering advanced notation, swimlanes, and complex workflow modeling.
- James Madison University: Visual Paradigm Activity Diagram Lab: Academic lab exercise for practicing Activity Diagram creation.
- SysML Activity Diagram Guide: Specialized guide for using Activity Diagrams within SysML for systems engineering.
- AI-Powered Use Case to Activity Diagram Generator: Third-party review and tutorial on leveraging Visual Paradigm’s AI tools for UML modeling.