


Software development involves two distinct languages: the syntax written by engineers and the visual representations used to plan and document systems. One is functional; the other is descriptive. The challenge lies in ensuring these two languages speak the same truth. Communication diagrams offer a powerful lens to visualize how objects interact, yet they often drift away from the actual implementation details found in source code. This guide explores the mechanics of aligning code structure with communication diagrams, ensuring that documentation remains a living artifact of the software architecture rather than an obsolete sketch.
🧩 Understanding the Core Components
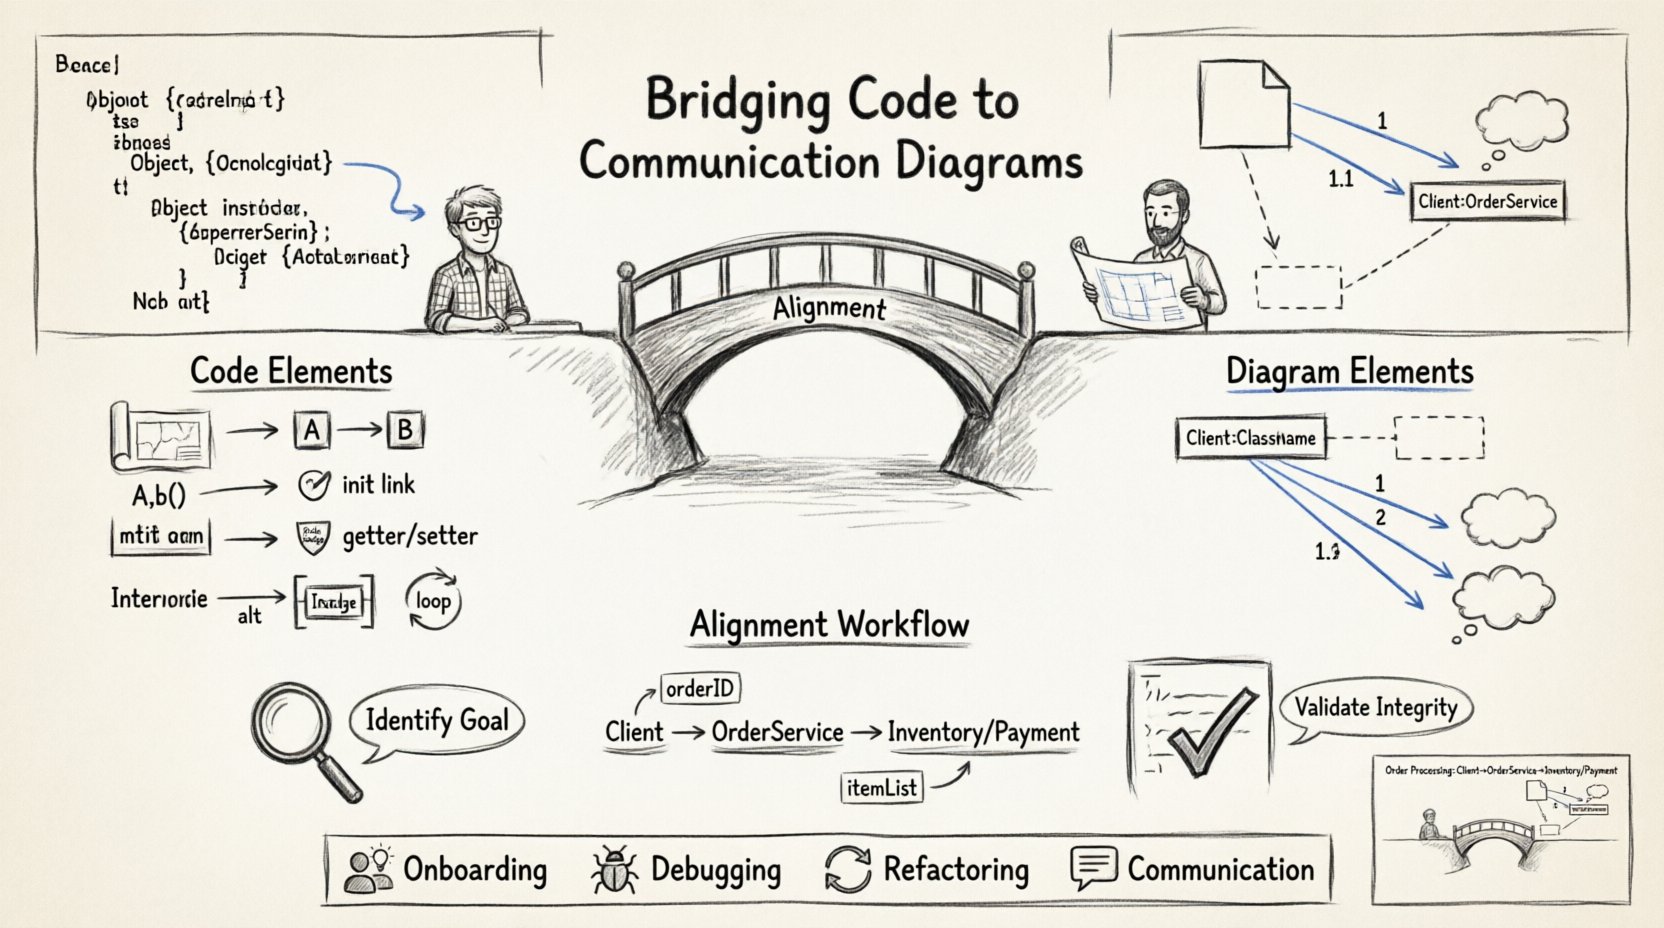
To bridge the gap effectively, we must first define the elements on both sides of the divide. On one side is the code, composed of classes, interfaces, methods, and properties. On the other is the diagram, composed of objects, links, and messages. Confusion arises when the terminology shifts between the two domains without clear mapping.
Code Side: Focuses on data encapsulation, logic execution, and dependency management.
Diagram Side: Focuses on flow, interaction sequences, and object relationships.
When these perspectives do not align, maintenance becomes difficult. Engineers may implement a feature that works logically but creates a diagram that suggests a different flow, leading to future bugs or confusion during code reviews.
📐 Key Elements of Communication Diagrams
A communication diagram is a type of Unified Modeling Language (UML) diagram. It emphasizes the structural organization of objects rather than the timing of messages, which is the focus of sequence diagrams. The primary elements include:
Objects: Instances of classes that participate in the interaction.
Links: Connections between objects that allow them to send messages to one another.
Messages: Signals sent from one object to another, triggering actions.
Notes: Annotations that provide context or constraints to the interaction.
💻 Mapping Code Structure to Diagram Elements
The translation process requires a disciplined approach. Every line of code that facilitates interaction should have a visual counterpart, and every visual connection should be traceable to a specific method or property. Below is a breakdown of how structural elements in source code translate to diagrammatic representations.
🔗 Objects and Classes
In the code, a class defines a blueprint. In the diagram, an object represents a specific instance of that blueprint. When creating a communication diagram, you are not drawing the class itself, but the runtime instances that interact.
Instantiation: When code creates a new instance (e.g.,
new Service()), the diagram shows a new object node.Singletons: If code enforces a single instance, the diagram should reflect this uniqueness, often by showing the object persisting across multiple message flows.
Interfaces: If code uses an interface, the diagram shows the object role rather than the concrete implementation.
📨 Methods as Messages
This is the most critical mapping. A method call in code is a message in a diagram. However, not every method call is a message sent between objects. Some methods operate within the scope of a single object (internal logic).
Public Methods: These are the candidates for external messages. If Object A calls Object B’s public method, this is a message link.
Private Methods: These remain internal and do not appear as inter-object messages.
Static Methods: These are tricky. They do not belong to an instance. In diagrams, they are often represented as actions on the class itself or omitted in favor of focusing on instance interactions.
🔗 Dependencies and Links
Links in a diagram represent the ability of one object to reach another. In code, this is typically achieved through dependency injection, constructor arguments, or property assignments.
Constructor Injection: If Object A requires Object B in its constructor, a link exists between them from the start.
Setter Injection: If Object A receives Object B via a setter method, the link is established after instantiation.
Local Variables: If Object A creates Object B locally, a link exists only during the scope of that method execution.
🛠️ The Process of Alignment
Creating a diagram that accurately reflects code requires a specific workflow. It is not enough to draw a diagram and then write code, nor is it sufficient to write code and draw a diagram later. The process must be iterative.
📝 Step 1: Identify the Interaction Goal
Before touching the code or the drawing tool, define the specific scenario. What is the user action? What is the system response? This narrows the scope. A communication diagram should not depict the entire system but a specific use case or flow.
Define the entry point (e.g., a Controller or Entry Point function).
Identify the boundary objects (e.g., Input, Output).
List the core business logic objects involved.
📝 Step 2: Trace the Data Flow
Walk through the code execution path. Start at the entry point and follow the method calls. Every time control moves from one object to another, record it.
Does the code pass parameters? Note the data type in the message label.
Does the code return a value? Indicate this in the diagram using arrows or distinct message numbering.
Are there loops? Communication diagrams are static, so loops must be represented by iteration notes or simplified as a single representative message.
📝 Step 3: Validate Structural Integrity
Once the draft is complete, verify it against the actual codebase. This step prevents “diagram drift,” where documentation becomes outdated.
Check if every object in the diagram is instantiated in the code path.
Check if every link in the diagram corresponds to a dependency in the code.
Check if any code dependencies are missing from the diagram.
🔄 Reverse Engineering: From Code to Diagram
Often, the code exists before the documentation. Reverse engineering a communication diagram from an existing codebase requires careful analysis. This is common when onboarding new team members or refactoring legacy systems.
🔍 Analyzing the Call Graph
Use static analysis tools or IDE features to generate a call graph. This visualizes which functions call which other functions. While this is not a communication diagram, it provides the raw data for the links.
Group by Class: Aggregate the call graph by class names to form object nodes.
Filter Noise: Ignore framework boilerplate and focus on business logic interactions.
Identify Cycles: Look for circular dependencies, which often appear as feedback loops in diagrams.
🔍 Extracting Message Semantics
A diagram needs more than just arrows. It needs labels. Extract the method names and parameter names from the code to label the messages.
Use the method signature to determine the message name.
Use comments or documentation strings to determine the message purpose.
Ensure the message direction matches the return type and execution flow.
📊 Comparison of Code Elements to Diagram Elements
The following table summarizes the translation rules between source code structures and communication diagram elements.
Code Element | Diagram Element | Mapping Rule |
|---|---|---|
Class | Object (Instance) | Create a node for each active instance in the scenario. |
Method Call (A.b()) | Message (A to B) | Draw an arrow from A’s object to B’s object. |
Constructor Argument | Link (Initialization) | Draw a link between objects before any messages are sent. |
Property Access (A.prop) | Read/Write Message | Label the message as a getter or setter action. |
Interface Implementation | Role | Label the object with the interface name, not the class name. |
Conditional Logic | Alt/Frame | Use frames to denote alternative paths or optional interactions. |
Loop/Iteration | Loop Frame | Encapsulate repeated messages in a loop frame. |
⚠️ Common Pitfalls and How to Avoid Them
Even with a clear mapping strategy, discrepancies occur. Recognizing common errors helps maintain the integrity of the documentation.
🚫 Over-Abstraction
It is tempting to simplify diagrams to make them easier to read. However, hiding too much detail can make the diagram useless for understanding the actual code structure. If the code handles error propagation, the diagram should reflect the error handling flow.
Do not hide critical exception handling paths.
Do not merge distinct objects if their lifecycles differ.
🚫 Timing Confusion
Communication diagrams do not inherently show time. If the order of operations is critical, ensure the message numbers (1, 1.1, 1.2) are used correctly. Avoid using the diagram to imply parallel processing unless explicitly noted.
Use sequential numbering for synchronous calls.
Use asynchronous markers for fire-and-forget messages.
🚫 Stale Documentation
Code changes frequently; diagrams often do not. When a feature is refactored, the diagram must be updated. Treat the diagram as code. If the code changes, the diagram changes.
Integrate diagram updates into the pull request workflow.
Review diagrams during code reviews.
🚀 Benefits of Synchronization
When code structure and communication diagrams are aligned, the benefits extend beyond simple documentation. It improves system understanding, reduces cognitive load, and accelerates troubleshooting.
Onboarding: New engineers can understand the system flow visually before diving into complex code.
Debugging: When a bug occurs, the diagram helps trace the expected path, making it easier to spot where the actual path diverged.
Refactoring: Visualizing dependencies helps identify coupling issues before changing code.
Communication: Architects and stakeholders can discuss system behavior without needing to read source code.
🛡️ Best Practices for Maintenance
Maintaining this alignment requires discipline. Here are strategies to keep the relationship healthy.
Single Source of Truth: Decide whether the code or the diagram is the primary reference. Usually, the code is the truth, and the diagram is the documentation.
Automated Generation: Where possible, use tools that generate diagrams from code annotations. This reduces manual effort.
Living Documentation: Store diagrams in the same repository as the code. This ensures version control alignment.
Minimalist Design: Keep diagrams simple. Only show interactions relevant to the specific use case.
📐 Handling Complexity
As systems grow, a single communication diagram becomes too large to be useful. Complexity management is essential.
Decomposition: Break complex flows into smaller sub-diagrams.
Abstraction: Use frames to hide lower-level details within a higher-level interaction.
Context: Provide a high-level overview diagram that points to detailed interaction diagrams.
🔍 Case Study: Order Processing
Consider a scenario involving an Order Processing system. The code contains an OrderService, a PaymentProcessor, and a InventoryManager. The code flow is: create order, check inventory, charge payment, confirm order.
In the diagram, this translates to:
Object 1: Client (Entry Point)
Object 2: OrderService
Object 3: InventoryManager
Object 4: PaymentProcessor
The messages would be numbered sequentially:
1.
createOrder()from Client to OrderService2.
checkStock()from OrderService to InventoryManager3.
processPayment()from OrderService to PaymentProcessor4.
confirm()from OrderService to Client
If the code changes to check inventory asynchronously, the diagram must update to reflect a return message or a separate interaction flow. This ensures the visual model matches the runtime behavior.
🎯 Final Thoughts on Structural Integrity
The relationship between code and diagrams is symbiotic. Code provides the reality; diagrams provide the context. When they diverge, the system becomes harder to maintain. By treating diagrams as functional artifacts that evolve with the code, teams can ensure clarity and reduce technical debt. Focus on consistency, validation, and clarity rather than perfect aesthetics. The value lies in the accuracy of the connection between the logic written and the logic visualized.
Adopting this disciplined approach transforms documentation from a burden into a strategic asset. It allows engineers to see the forest through the trees, understanding not just what the code does, but how the pieces fit together to form a cohesive whole.
Remember, the goal is understanding, not decoration. Keep the diagram relevant, accurate, and accessible. When the code changes, the diagram changes. When the diagram is updated, the understanding improves. This cycle drives quality and stability in software architecture.