


Introduction: Why Timing Diagrams Matter More Than You Think
As someone who’s spent years navigating the complex world of system architecture and real-time software design, I’ve come to appreciate one truth: time is not just a variable—it’s the canvas. Whether you’re modeling embedded systems, coordinating microservices, or debugging hardware-software handshakes, understanding when things happen is often more critical than what happens.

That’s where UML Timing Diagrams come in. Yet, for all their power, they’ve historically been intimidating—dense notation, precise alignment requirements, and a steep learning curve that left many teams skipping them entirely. Recently, I decided to revisit Timing Diagrams using Visual Paradigm, both its traditional manual tools and its new AI-powered generation feature. What followed was a transformative experience that changed how I approach time-critical system documentation. This guide shares my journey, insights, and practical takeaways—written from the perspective of a practitioner, not a vendor.
What Exactly Is a Timing Diagram? (And Why Should You Care?)
Timing diagrams are a specialized type of UML interaction diagram designed to reason about time. Unlike sequence diagrams that focus on message order, Timing Diagrams visualize how conditions and states change along a linear time axis for one or more lifelines.

In my work on IoT device coordination, I found Timing Diagrams invaluable for specifying:
-
Sensor sampling intervals
-
Communication timeout windows
-
State transition deadlines
-
Concurrent process synchronization
The diagram’s strength lies in its dual representation: you can model both state changes (e.g., Idle → Active → Error) and value changes (e.g., voltage levels, signal states) over time.
Timing Diagram at a Glance: Two Ways to Visualize Time
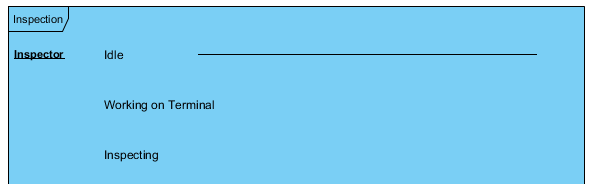
State Timeline Representation
Changes from one state to another appear as vertical shifts in the lifeline level. While an object remains in a state, the timeline runs horizontally at that level.

💡 Pro Tip from My Experience: Start with state timelines when modeling control logic. They’re more intuitive for representing finite state machines.
Value Lifeline Representation
An alternative notation shows values between two horizontal lines that cross at each change point—a compact, waveform-like view ideal for signal analysis.

🎯 When I Use This: For hardware interface specs or analog/digital signal documentation, the value lifeline saves space and improves readability.
Core Building Blocks: What Makes a Timing Diagram Tick
Lifelines: The Participants in Time
A lifeline represents an individual participant (object, component, actor) in the interaction. In Visual Paradigm, lifelines appear as horizontal rectangular spaces within a timing frame.

Stack multiple lifelines vertically to model interactions:

State vs. Value Timelines: Choosing Your Representation
State Timeline: States are listed on the left margin; the timeline moves horizontally through time, shifting vertically when state changes occur.

Value Lifeline: Shows continuous or discrete value changes with crossing horizontal lines at transition points.

Messages, Constraints, and Time Markers
Arrows between lifelines represent messages. The start/end points indicate send/receive times. You can add:
-
Time units: Tick marks along the bottom axis
-
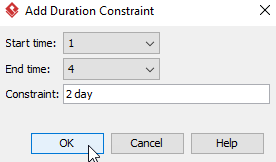
Duration constraints: Specify how long a state must last
-
Relative time markers: Use variables like
t_sendMailfor flexible constraints

Mixing State and Value Lifelines
One of Visual Paradigm’s strengths is allowing hybrid diagrams—state lifelines for control logic, value lifelines for data signals, all in one frame.

🔧 My Workflow: I typically start with state lifelines for the main control flow, then overlay value lifelines for critical signals that need precise timing annotation.
Keeping Models Consistent: Timing Diagrams Don’t Exist in Isolation
A Timing Diagram should align with your sequence diagrams and state machines. Visual Paradigm helps by letting you attach states to lifelines in sequence diagrams, then derive corresponding timing views.


✅ Validation Strategy I Use: After drafting a sequence diagram, I export key interactions to a timing diagram to verify temporal constraints. Discrepancies often reveal hidden race conditions.
My Hands-On Experience: Drawing Timing Diagrams the Traditional Way
Step-by-Step Workflow in Visual Paradigm Desktop
-
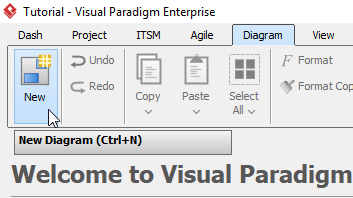
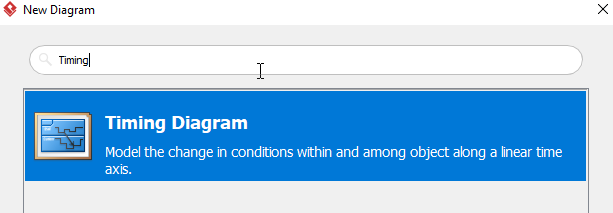
Create New Diagram:
Diagram > New > Timing Diagram
-
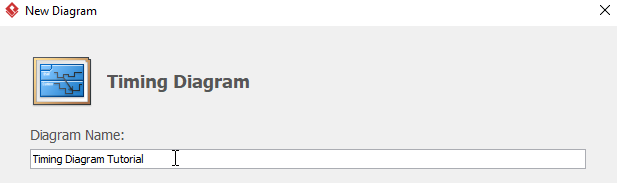
Name and Setup: Choose a descriptive name (e.g., “Sensor Handshake Protocol”)
-
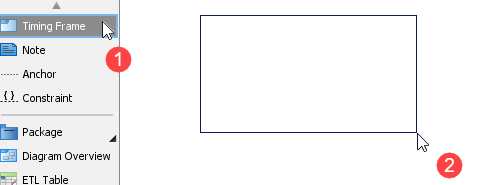
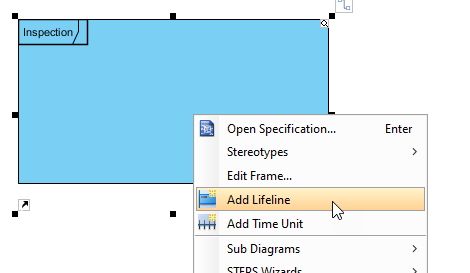
Add Timing Frame: Drag to create the container for your diagram
-
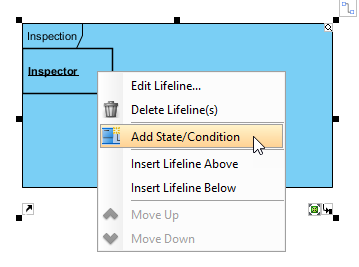
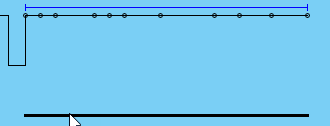
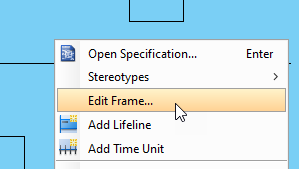
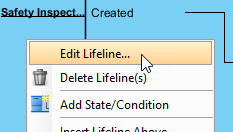
Build Lifelines and States: Right-click frame →
Add Lifeline, then add states/conditions
-
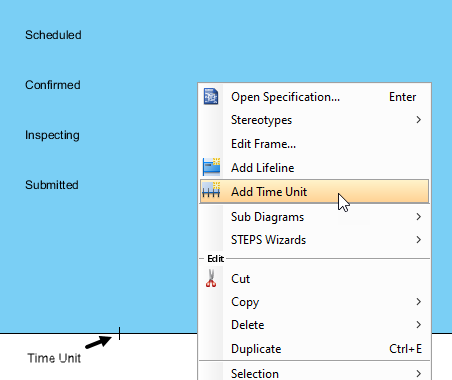
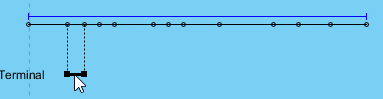
Add Time Units: Right-click empty space →
Add Time Unit, then label and position
-
Adjust State Segments: Drag line segments to align states with time markers
-
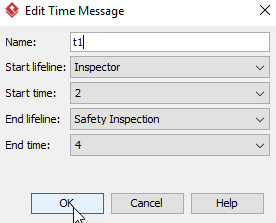
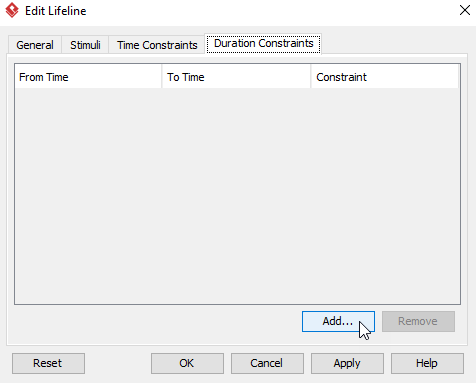
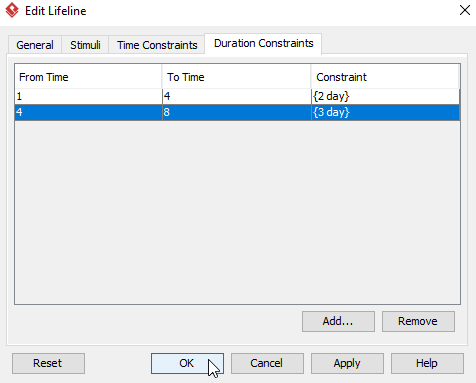
Add Messages and Constraints: Use
Edit Framefor time messages,Edit Lifelinefor duration constraints
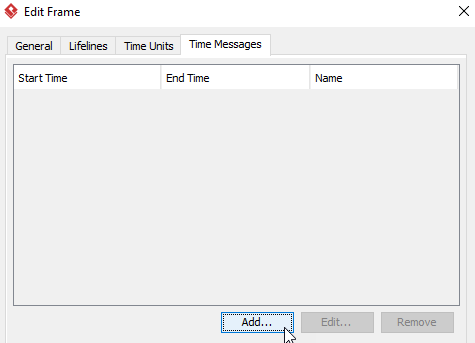
-
Final Result: A precise, constraint-rich timing specification
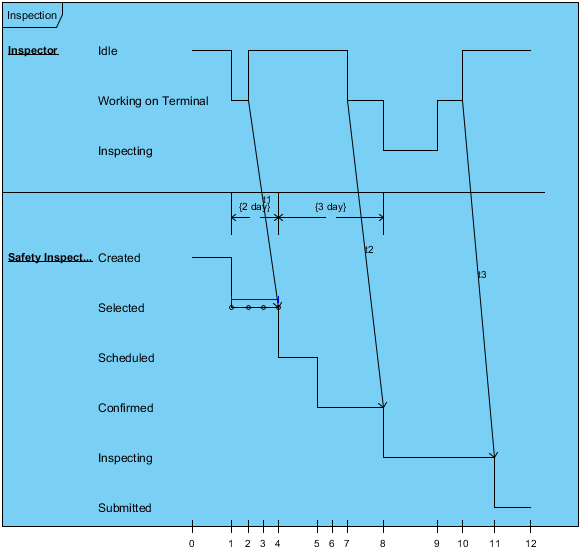
⏱️ My Time Investment: For a moderately complex 3-lifeline diagram with 8 states and 4 constraints, manual creation took ~45 minutes. Accuracy was high, but iteration was slow.
The Game Changer: AI-Powered Timing Diagram Generation
The Problem with Manual Creation (From My Desk)
Before Visual Paradigm’s AI feature, Timing Diagrams felt like a necessary evil:
-
Precision overhead: Aligning waveforms manually was tedious
-
Iteration friction: Small spec changes meant redrawing entire sections
-
Knowledge barrier: Team members avoided them due to notation complexity
Enter AI Diagram Generation
Visual Paradigm’s new AI feature lets you generate Timing Diagrams from natural language prompts. Here’s how I used it:
-
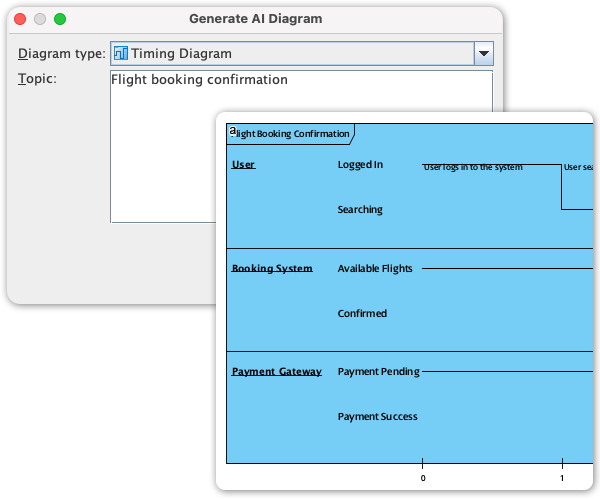
Navigate to
Tools > AI Diagram > Timing Diagram -
Enter a prompt: “Generate a timing diagram for a door lock system: sensor detects motion at t=0, controller processes for 2 time units, actuator engages for 3 units, timeout if no confirmation by t=10”
-
Click OK and watch the diagram appear
What Impressed Me
| Aspect | My Observation |
|---|---|
| Speed | Full diagram generated in <15 seconds vs. 45+ minutes manually |
| Accuracy | AI correctly applied UML notation rules I sometimes forget |
| Flexibility | Follow-up prompts like “Add retry logic after timeout” updated the diagram conversationally |
| Learning Aid | Great for onboarding junior engineers—see specs turn into visuals instantly |
🚀 Real-World Impact: On a recent project, I used AI generation to rapidly prototype 5 timing scenarios for a communication protocol. What would have taken a day took 2 hours, freeing time for actual validation.
Desktop vs. Online: Which Visual Paradigm Version Fits Your Needs?
| Feature | Visual Paradigm Desktop | Visual Paradigm Online |
|---|---|---|
| Best For | Complex engineering, code generation, enterprise modeling | Quick collaboration, cloud access, lightweight projects |
| Timing Diagram Support | Full-featured with AI generation (Professional+) | Basic to intermediate; AI available in premium tiers |
| Offline Access | ✅ Yes | ❌ Browser-dependent |
| Collaboration | Version control, team repositories | Real-time co-editing, shareable links |
| Learning Curve | Steeper, but more powerful | Gentle, intuitive interface |
🎯 My Recommendation: Use Desktop for hardware/embedded systems work requiring precision. Choose Online for agile teams needing fast, collaborative diagramming.
Traditional vs. AI-Powered: A Practitioner’s Comparison
| Criteria | Manual Creation | AI Generation |
|---|---|---|
| Input Method | Drag-and-drop shapes, manual timeline setup | Natural language text prompts |
| Time to First Draft | 30-60 minutes for moderate complexity | 10-30 seconds |
| Notation Accuracy | Depends on user expertise | AI enforces UML rules automatically |
| Iteration Speed | Manual adjustments for each change | Conversational edits via follow-up prompts |
| Best Use Case | Final documentation, highly customized diagrams | Rapid prototyping, exploration, team alignment |
💡 Hybrid Approach I Now Use: Start with AI to generate a baseline diagram, then switch to manual mode for fine-tuning constraints and adding project-specific annotations.
Practical Tips from My Timing Diagram Journey
-
Start Simple: Begin with 2-3 lifelines before scaling up
-
Name Time Markers: Use variables like
t_start,t_timeoutfor maintainable constraints -
Leverage Consistency Checks: Cross-reference with sequence diagrams to catch temporal gaps
-
Use AI for Exploration: Generate multiple “what-if” scenarios quickly, then refine the best candidate manually
-
Document Constraints Clearly: Duration constraints prevent ambiguous interpretations during implementation
Conclusion: Timing Diagrams Are Finally Accessible—Here’s How to Get Started
My journey with UML Timing Diagrams transformed from reluctant obligation to strategic advantage. The combination of Visual Paradigm’s robust manual tools and groundbreaking AI generation has lowered the barrier to entry while preserving the precision that makes these diagrams valuable.
If you’re new to Timing Diagrams: Start with Visual Paradigm Online’s free tier. Use AI generation to create your first diagram from a simple prompt. Focus on understanding state transitions before adding complex constraints.
If you’re an experienced modeler: Explore the Desktop edition’s AI features to accelerate prototyping. Use the hybrid workflow—AI for speed, manual editing for precision—to maximize productivity.
For teams: Standardize on a template library. Use AI to ensure consistency across members, then manually refine for project-specific needs.
Timing is everything in system design. With the right tools and approach, Timing Diagrams stop being a documentation chore and become a powerful lens for building reliable, time-aware systems.
🌟 Final Thought: The best diagram isn’t the most complex—it’s the one that clearly communicates temporal behavior to your team. Whether you choose manual precision or AI-powered speed, the goal remains the same: make time visible, understandable, and actionable.
References
-
Visual Paradigm Circuit Diagram Tool: Overview of Visual Paradigm’s diagramming capabilities including shape alignment guides and professional modeling features.
-
AI Diagram Generation: Timing Diagram Support Announcement: Official release notes detailing the new AI-powered Timing Diagram generation feature in Visual Paradigm.
-
Timeline Diagram Templates in VP Online: Collection of pre-built timeline diagram templates for quick start in Visual Paradigm Online.
-
Community Discussion: ERD Modeling in VP Online: User forum thread discussing diagram modeling capabilities and collaboration features in the online platform.
-
Desktop vs. Online: Comprehensive Comparison Guide: Third-party analysis comparing features, use cases, and pricing between Visual Paradigm Desktop and Online editions.
-
VP Online Desktop Accessibility Features: Documentation on accessibility options and cross-platform support for Visual Paradigm Online.
-
Guide to AI-Powered UML Diagram Generation: Tutorial resource for using AI chatbot assistance to generate and refine UML diagrams.
-
Simplify Diagramming with Online Chart Solutions: Blog post highlighting how VP Online streamlines diagram creation for teams and individuals.
-
Official User Guide: Drawing Timing Diagrams: Step-by-step official documentation for creating Timing Diagrams in Visual Paradigm Desktop.
-
Why Teams Need AI Diagram Makers for Faster Kickoff: Article discussing productivity benefits of AI-assisted diagramming for project initialization.
-
AI Diagram Generator Release Notes: Broader announcement of AI diagram generation capabilities across multiple UML diagram types.
-
AI Activity Diagram Generation Update: Related release detailing AI support for Activity Diagrams, demonstrating platform-wide AI integration.
-
AI Chatbot Feature Overview: Product page describing conversational AI assistance for diagram creation and refinement.
-
Visual Paradigm Tutorial Video: Timing Diagrams: Video walkthrough demonstrating Timing Diagram creation techniques in Visual Paradigm.