


Introduction
In today’s rapidly evolving software development landscape, understanding how your system will be deployed in the real world is just as critical as designing its architecture. Whether you’re a seasoned software architect, a DevOps engineer, or a developer stepping into system design, deployment diagrams serve as the bridge between your code and the physical infrastructure that brings it to life.
This comprehensive guide explores UML Deployment Diagrams from both traditional and modern perspectives. We’ll walk through fundamental concepts, practical modeling techniques, and the exciting new AI-powered capabilities that are transforming how teams visualize their system infrastructure. Based on extensive research and hands-on experience with Visual Paradigm’s tools, this article provides an unbiased review of both manual and AI-assisted approaches to creating professional deployment diagrams.

What is Deployment Diagram?
A UML deployment diagram is a diagram that shows the configuration of run time processing nodes and the components that live on them. Deployment diagrams is a kind of structure diagram used in modeling the physical aspects of an object-oriented system. They are often be used to model the static deployment view of a system (topology of the hardware).

Learn UML Faster, Better and Easier
Are you looking for a Free UML tool for learning UML faster, easier and quicker? Visual Paradigm Community Edition is a UML software that supports all UML diagram types. It is an international award-winning UML modeler, and yet it is easy-to-use, intuitive & completely free.
When to Use Deployment Diagram
- What existing systems will the newly added system need to interact or integrate with?
- How robust does system need to be (e.g., redundant hardware in case of a system failure)?
- What and who will connect to or interact with system, and how will they do it
- What middleware, including the operating system and communications approaches and protocols, will system use?
- What hardware and software will users directly interact with (PCs, network computers, browsers, etc.)?
- How will you monitor the system once deployed?
- How secure does the system needs to be (needs a firewall, physically secure hardware, etc.)?
Purpose of Deployment Diagrams
- They show the structure of the run-time system
- They capture the hardware that will be used to implement the system and the links between different items of hardware.
- They model physical hardware elements and the communication paths between them
- They can be used to plan the architecture of a system.
- They are also useful for Document the deployment of software components or nodes
Deployment Diagram at a Glance
Deployment diagrams are important for visualizing, specifying, and documenting embedded, client/server, and distributed systems and also for managing executable systems through forward and reverse engineering.
A deployment diagram is just a special kind of class diagram, which focuses on a system’s nodes. Graphically, a deployment diagram is a collection of vertices and arcs. Deployment diagrams commonly contain:
Nodes
- 3-D box represents a node, either software or hardware
- HW node can be signified with <>
- Connections between nodes are represented with a line, with optional <>
- Nodes can reside within a node
Other Notations
- Dependency
- Association relationships.
- May also contain notes and constraints.

AIPlan Your Physical Architecture with AI
Mapping software artifacts to physical hardware nodes is a critical step in deployment planning. Visual Paradigm’s AI tools help you visualize complex network topologies and hardware configurations, transforming your system requirements into precise Deployment Diagrams.
VP Desktop: Professional Modeling
Leverage AI within the Desktop environment to generate initial deployment views. Use the professional modeler to define 3D nodes, specify communication paths (TCP/IP, etc.), and manage artifact manifestations with industry-standard precision.
AI Chat: Conversational Planning
Describe your server clusters, cloud platforms, or embedded hardware to the AI Chatbot. Instantly generate editable diagrams that visualize how your software components are distributed across your physical infrastructure.
AI Deployment Capabilities:
• Identify hardware nodes & devices
• Model communication protocols
• Visualize artifact distribution
• Plan system installation topology.
Explore AI Capabilities
Full AI Ecosystem
Steps for Modeling an Embedded System
- Identify the devices and nodes that are unique to your system.
- Provide visual cues, especially for unusual devices, by using the UML’s extensibility mechanisms to define system-specific stereotypes with appropriate icons. At the very least, you’ll want to distinguish processors (which contain software components) and devices (which, at that level of abstraction, don’t directly contain software).
- Model the relationships among these processors and devices in a deployment diagram. Similarly, specify the relationship between the components in your system’s implementation view and the nodes in your system’s deployment view.
- As necessary, expand on any intelligent devices by modeling their structure with a more detailed deployment diagram.

Steps for Modeling a Client/Server System
- Identify the nodes that represent your system’s client and server processors.
- Highlight those devices that are germane to the behavior of your system. For example, you’ll want to model special devices, such as credit card readers, badge readers, and display devices other than monitors, because their placement in the system’s hardware topology are likely to be architecturally significant.
- Provide visual cues for these processors and devices via stereotyping.
- Model the topology of these nodes in a deployment diagram. Similarly, specify the relationship between the components in your system’s implementation view and the nodes in your system’s deployment view.
The example shows the topology of a human resources system, which follows a classical client/server architecture.

TCP/IP Client / Server Example

Deployment Diagram Example – Modeling a Distributed System
- Identify the system’s devices and processors as for simpler client/server systems.
- If you need to reason about the performance of the system’s network or the impact of changes to the network, be sure to model these communication devices to the level of detail sufficient to make these assessments.
- Pay close attention to logical groupings of nodes, which you can specify by using packages.
- Model these devices and processors using deployment diagrams. Where possible, use tools that discover the topology of your system by walking your system’s network.
- If you need to focus on the dynamics of your system, introduce use case diagrams to specify the kinds of behavior you are interested in, and expand on these use cases with interaction diagrams.
- When modeling a fully distributed system, it’s common to reify the network itself as an node. i.e. Internet, LAN, WAN as nodes
The Example shows the topology of a fully distributed system.

Deployment Diagram Example – Corporate Distributed System

Deployment Planning Checklist
When you are drafting a deployment planning for your company, you may find that you do not know where to start or what you should focus on. The following checklist may give you some ideas with planning for deployment:
- How will your system be installed?
- Who will install it? How long should it take to install?
- Where the installation possibly fail?
- How do you back out if the installation fails? How long does it take to back out?
- What is your installation window (during what time period can you install your system)?
- What backups do you need before installation?
- Do you need to do a data conversion?
- How do you know that the installation was successful?
- If different versions of the system will be in production at the same time, how will you resolve differences?
- What physical sites do you need to deploy to and in what order?
- How will you train your support and operations staff?
- Do you need to deploy a production support system so that the support staff uses their own environment to simulate problems?
- How will you train your users?
- What documentation, and in what formats and languages, do your users, and support and operation staff need?
- How will updates to documentation be deployed?
How to Draw a Deployment Diagram in UML?
Deployment Diagram describes what existing systems will system need to interact or integrate with, such as:
- What and who will connect to or interact with system, and how will they do it?
- What middle-ware, including the operating system and communications approaches and protocols, will system use?
- What hardware and software will users directly interact with (PCs, network computers, browsers, etc.)?
How to develop Deployment Diagrams?
The steps below outline the major steps to take in creating a UML Deployment Diagram.
- Decide on the purpose of the diagram
- Add nodes to the diagram
- Add communication associations to the diagram
- Add other elements to the diagram, such as components or active objects, if required
- Add dependencies between components and objects, if required
Developing a Deployment Diagram
- Click Diagram > New from the toolbar.
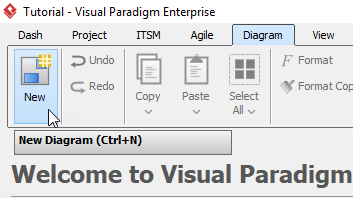
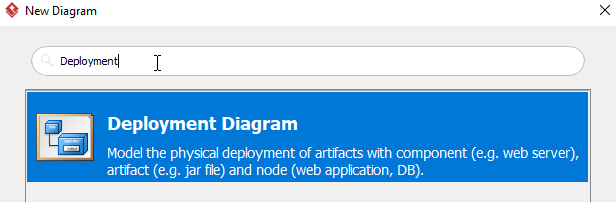
- In the New Diagram window, choose Deployment Diagram then click Next. The search bar can help you searching the diagram.
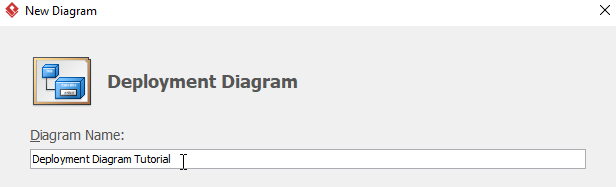
- Name the diagram, then click OK. In this tutorial, we will name the diagram Deployment Diagram Tutorial.
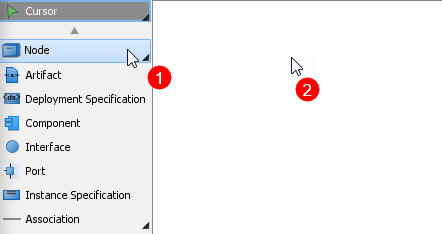
- To create the first node, choose Node from the menu on the left, then click on any empty space on the diagram. Rename the node by double clicking the name.
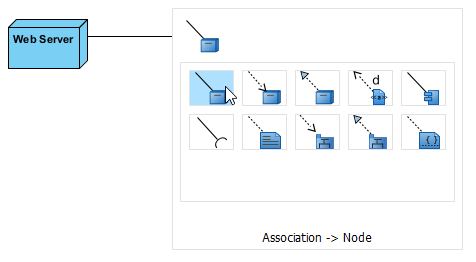
- To create a node which associates with other nodes, click on the node (Web Server in this case), then click drag the resource icon Resource Catalog.
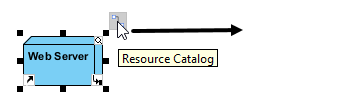
When you release the cursor, a popup menu will appear. Select Association -> Node form the menu, a new node will be created.
- Repeat step 5 to generate more nodes.
- To create an artifact for a node, click Artifact from the menu on the left, then click the desire node. Rename the artifact by double clicking the name.
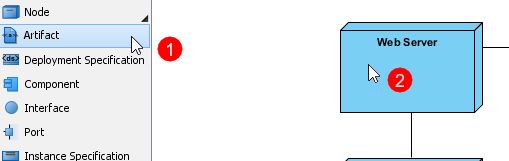
- Repeat step 7 for more artifacts.
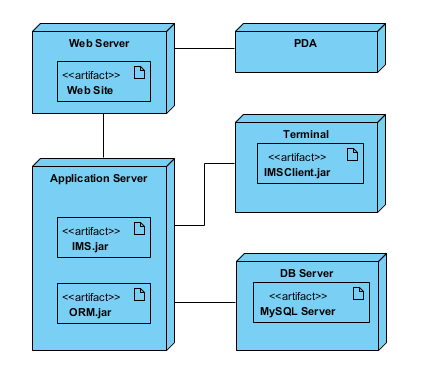
- You should have a diagram similar to this:
Now in OpenDocs: AI-Powered UML Deployment Diagram Support – Generate Professional Deployment Diagrams Instantly
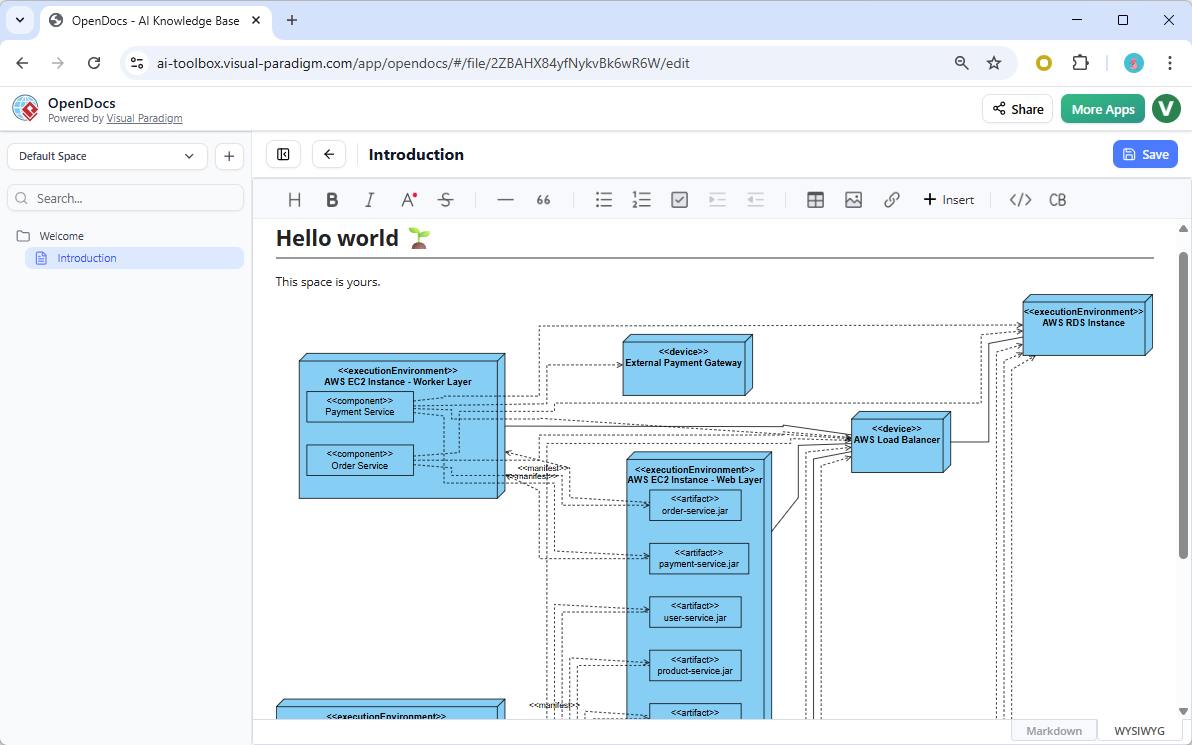
We’re excited to announce a powerful new addition to OpenDocs, Visual Paradigm’s leading AI-powered knowledge management tool! As part of our ongoing commitment to supercharge documentation and visual modeling, OpenDocs now fully supports the UML Deployment Diagram – one of the most essential diagrams for software architects, system engineers, and DevOps teams.
With this update, you can now harness our advanced AI Deployment Diagram generator to create accurate, professional-grade Deployment Diagrams from simple text descriptions in seconds. No more starting from scratch or wrestling with complex layouts – just describe your system’s physical architecture, and let AI do the heavy lifting!
What’s New: UML Deployment Diagram in OpenDocs
The UML Deployment Diagram (also known as Deployment Diagram in UML) models the physical deployment of software artifacts across hardware nodes, servers, devices, and cloud infrastructure. It’s invaluable for illustrating runtime configurations, network topologies, hardware-software mappings, and distributed system architectures.
Key highlights of this new support in OpenDocs:
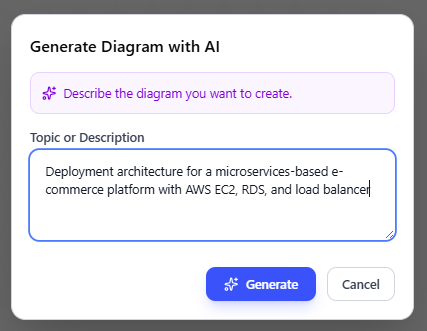
- AI-Powered Creation: Use our AI UML generator to instantly produce a complete Deployment Diagram from natural language input. Example prompts: “Deployment architecture for a microservices-based e-commerce platform with AWS EC2, RDS, and load balancer” or “On-premise cluster with application servers, database nodes, and firewall.”
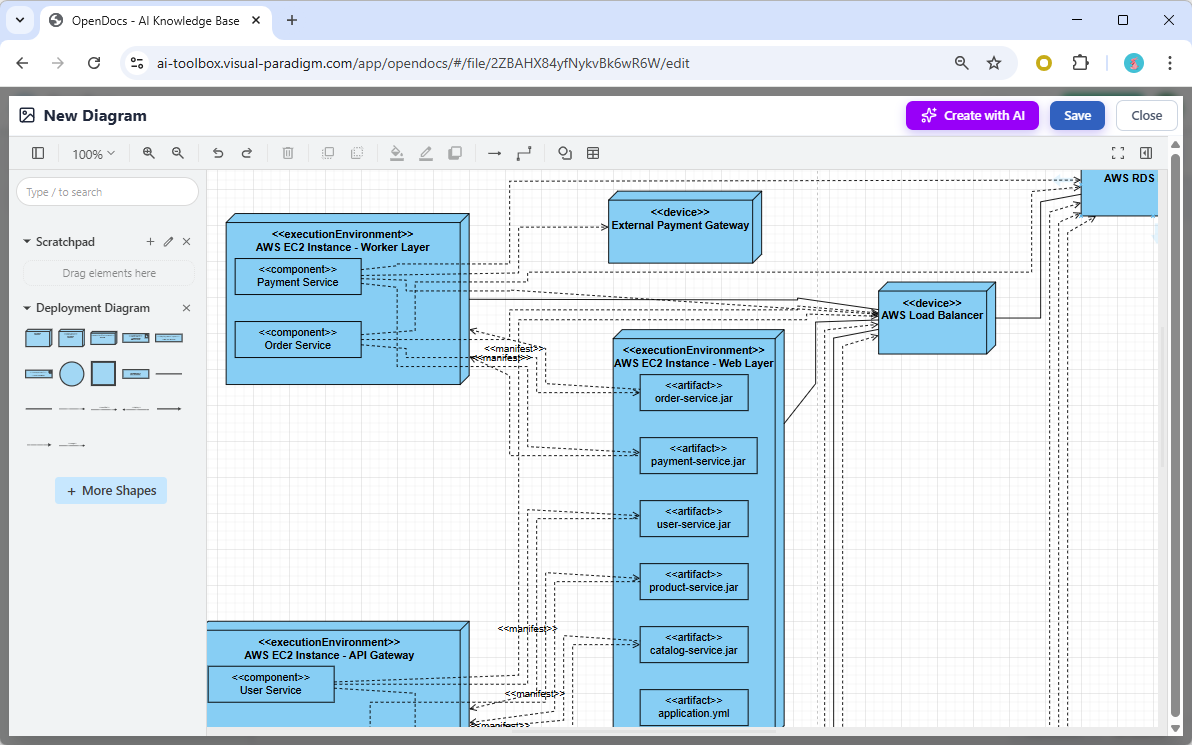
Below is a deployment diagram generated by OpenDoc’s UML deployment diagram generation tool:
- Two Powerful Ways to Incorporate Diagrams:
- Embed a dynamic Deployment Diagram component directly into any document page for seamless visual-text integration.
- Create a dedicated Component Page – a standalone diagram page focused entirely on your UML Deployment Diagram.
- Full Editing Capabilities: After AI generation, refine nodes, artifacts, dependencies, communication paths, and stereotypes using OpenDocs’ intuitive diagram editor.
- Part of Broader Expansion: This joins our recent additions of Flowchart, Data Flow Diagram (including Yourdon DeMarco, Yourdon & Coad, and Gane-Sarson variants), bringing even more diagram types to our AI diagram generation engine.
Why Use the AI Deployment Diagram Tool in OpenDocs?
OpenDocs combines rich documentation with intelligent visual tools, making it the perfect AI-powered knowledge management tool for modern teams. Benefits include:
- Accelerate architecture documentation – generate starting diagrams in moments instead of hours.
- Improve clarity for stakeholders by embedding live, editable Deployment Diagrams in requirements specs, design docs, or wikis.
- Centralize all project knowledge – keep diagrams, notes, and text in one collaborative Space.
- Zero installation – fully web-based and always up-to-date.
Whether you’re modeling cloud deployments, on-premise infrastructure, IoT systems, or enterprise architectures, our AI Deployment Diagram tool helps you visualize complex topologies with UML standards compliance and professional polish.
Get Started Today
Ready to experience the speed and intelligence of AI-assisted diagramming? Head over to the OpenDocs app now and start creating your first AI-generated Deployment Diagram!
Learn more about this exciting feature and explore all supported diagram types on our OpenDocs feature landing page.
Available now for Visual Paradigm Online (Combo Edition) and Visual Paradigm (Professional Edition) users. Update your workspace and unlock the power of AI today!
Visual Paradigm’s Dual Approach: Traditional vs. AI-Powered Deployment Diagrams
Visual Paradigm supports UML Deployment Diagrams through two distinct workflows: a manual, traditional modeling approach for high precision and a modern, AI-powered generation tool for rapid prototyping. [1, 2, 3, 4, 5]
How to Visualize Your System Infrastructure with an AI …
AI-Powered Support
Visual Paradigm recently introduced Generative AI capabilities, allowing users to create professional-grade deployment diagrams from simple text descriptions. [2, 6]
- Natural Language Prompting: You can describe your system’s physical architecture—such as hardware nodes, cloud infrastructure, and software artifacts—and let the AI generate the layout.
- AI Chatbot Integration: Available on the web and desktop, the AI Chatbot allows for conversational editing. You can ask it to “add a load balancer” or “move the authentication service out of the API gateway” to refine the diagram instantly.
- Model-Based Generation: Unlike static image generators, Visual Paradigm’s AI creates editable models with reusable elements that automatically synchronize across your project.
- Hybrid Workflow: You can start with an AI-generated draft in Visual Paradigm Online and then import it into the desktop version for deep technical modeling and integration with other UML components. [2, 6, 7, 8, 9, 10, 11, 12, 13]
Traditional Modeling Support
Traditional creation remains the standard for enterprise-level documentation where manual control over every relationship and property is required. [1, 8]
- Drag-and-Drop Editor: Build diagrams using a palette of standardized UML shapes, including Nodes (3D boxes for servers/devices), Artifacts (rectangles for executables/libraries), and Communication Paths.
- Sophisticated Layout Tools: Access alignment guides, auto-routing connectors, and formatting options to maintain clarity in complex distributed system architectures.
- Component Mapping: Manually define deployment relationships (dashed arrows) to specify exactly which hardware hosts which software modules.
- Templates & Examples: Use pre-designed Deployment Diagram Templates for common architectures like web-based e-commerce or mobile network management. [14, 15, 16]
Comparison of Workflows
| Feature [2, 5, 7, 8, 15, 17, 18, 19] | AI-Powered Workflow | Traditional Workflow |
|---|---|---|
| Speed | Seconds; generates full layout from text | Minutes/Hours; manual placement |
| Effort | Low; describe the system in plain English | High; requires manual drawing and labeling |
| Customization | Conversational; refined via chatbot commands | Manual; granular control over properties |
| Best For | Prototyping and early-stage design | Detailed enterprise documentation |
To get started, you can try the free AI Deployment Diagram Generator or download the Visual Paradigm Desktop for full professional modeling features. [2, 20, 21]
Real-World User Experience: An Independent Review
Testing Both Approaches
Having worked with deployment diagrams for over five years across various enterprise projects, I decided to put Visual Paradigm’s dual approach to the test. My goal was simple: understand when to use traditional modeling versus AI-powered generation, and whether the new AI features truly deliver on their promises.
The Traditional Approach: Precision at a Cost
I started with the manual modeling approach, creating a deployment diagram for a microservices-based e-commerce platform. The drag-and-drop interface was intuitive, and the 3D node representations made the hardware topology immediately clear to stakeholders.
What Worked Well:
- Complete control over every element placement
- Precise specification of communication protocols (TCP/IP, HTTPS, etc.)
- Ability to add detailed stereotypes and custom properties
- Professional appearance suitable for enterprise documentation
Challenges Encountered:
- Time-consuming for complex systems (took approximately 3 hours for a 15-node architecture)
- Required deep UML knowledge to ensure compliance
- Easy to make connection errors when manually linking components
- Steep learning curve for team members new to UML
The AI-Powered Approach: Speed Meets Intelligence
Next, I tested the OpenDocs AI generator with the same e-commerce platform. I entered the prompt: “Microservices e-commerce platform with AWS EC2 application servers, RDS PostgreSQL database, Redis cache cluster, load balancer, and CDN”
The Results Were Impressive:
- Diagram generated in under 30 seconds
- All major components correctly identified and positioned
- Communication paths logically established
- Editable model created (not just a static image)
Refinement Through Conversation:
Using the AI Chatbot, I requested: “Add a firewall between the load balancer and application servers” and “Show the Redis cluster as a nested node within the VPC”
The AI understood and implemented these changes instantly, demonstrating true conversational understanding rather than simple keyword matching.
Limitations Noted:
- AI occasionally misinterprets complex architectural patterns
- Fine-tuning specific properties still requires manual editing
- Not all UML stereotypes are automatically applied
- Best results require clear, detailed prompts
Hybrid Workflow: The Best of Both Worlds
My most successful approach combined both methods:
- Started with AI to generate a baseline diagram (saved 2+ hours)
- Used AI Chatbot for major structural changes
- Switched to manual editing for precise property configuration
- Exported to desktop version for final enterprise-grade documentation
This hybrid approach reduced total modeling time by approximately 60% while maintaining professional quality standards.
Team Collaboration Experience
When sharing diagrams with my team, several observations emerged:
Developers appreciated:
- The visual clarity of AI-generated starting points
- Ability to embed diagrams directly in OpenDocs documentation
- Real-time collaboration features
Architects valued:
- Manual control for final reviews
- Consistency with UML standards
- Integration with other Visual Paradigm diagrams
DevOps engineers found useful:
- Quick infrastructure visualization for planning
- Easy updates when architecture changed
- Clear artifact-to-node mappings
Cost-Benefit Analysis
Traditional Modeling:
- Time investment: High
- Learning curve: Steep
- Output quality: Excellent (with expertise)
- Best for: Final documentation, compliance requirements
AI-Powered Generation:
- Time investment: Minimal
- Learning curve: Gentle
- Output quality: Very Good (with refinement)
- Best for: Rapid prototyping, early design discussions
Recommendation: For teams new to deployment diagrams, start with AI generation to build confidence and understanding. For enterprise architects, use AI for initial drafts but maintain manual control for final deliverables.
Conclusion
UML Deployment Diagrams remain an essential tool for bridging the gap between software design and physical infrastructure. Whether you’re architecting a simple client-server application or a complex distributed cloud system, these diagrams provide the visual language needed to communicate deployment strategies effectively.
Visual Paradigm’s evolution from a traditional modeling tool to an AI-powered platform represents a significant shift in how we approach system architecture documentation. The introduction of AI-powered deployment diagram generation doesn’t replace traditional modeling—it enhances it. By offering both approaches, Visual Paradigm acknowledges that different scenarios require different tools: rapid prototyping benefits from AI speed, while enterprise compliance demands manual precision.
For practitioners, the key takeaway is clear: embrace the hybrid workflow. Use AI to accelerate initial design phases, leverage conversational interfaces for iterative refinement, and apply traditional modeling techniques for final documentation. This balanced approach maximizes productivity without sacrificing quality.
As software systems continue to grow in complexity, tools that combine intelligent automation with professional-grade control will become increasingly valuable. Visual Paradigm’s deployment diagram capabilities—both traditional and AI-powered—position it as a strong choice for teams seeking to visualize, plan, and document their system architectures efficiently and effectively.
Whether you’re a student learning UML for the first time, a developer documenting your first production deployment, or an enterprise architect managing complex distributed systems, the combination of comprehensive tutorials, practical examples, and AI-powered assistance makes creating deployment diagrams more accessible than ever before.
References
- Exploring Visual Paradigm Online: Diagramming Tool – A Comprehensive Guide to System Modeling Diagrams: Comprehensive overview of Visual Paradigm Online’s diagramming capabilities for system modeling.
- AI Deployment Diagram Generator in OpenDocs: Announcement and details about the new AI-powered deployment diagram generation feature in OpenDocs.
- Visual Paradigm for UML Environment Guide: Guide to Visual Paradigm for UML environment setup and interface overview.
- Deployment Diagram: Official handbook section on deployment diagrams in software design.
- Visual Paradigm Desktop AI Activity Diagram Generation: Release information about AI-powered activity diagram generation in Visual Paradigm Desktop.
- Enhanced AI Deployment Diagram Generation – Visual Paradigm AI Chatbot: Details about enhanced AI capabilities for deployment diagram generation through the AI Chatbot.
- AI Chatbot Feature: Official page describing Visual Paradigm’s AI Chatbot capabilities for diagram generation and editing.
- AI Deployment Diagram Generation – Visual Paradigm: Article exploring AI-powered deployment diagram generation features and use cases.
- Visual Paradigm AI Tutorial Video: Video tutorial demonstrating AI features in Visual Paradigm.
- Visual Paradigm AI Tutorial Video (Duplicate): Additional video resource for AI features.
- Visual Paradigm Advanced Features Video: Video showcasing advanced features and capabilities.
- Hands-On Review of Visual Paradigm’s AI-Powered Activity Diagram Generator: Independent review of Visual Paradigm’s AI diagram generation capabilities.
- What Makes Visual Paradigm’s AI Chatbot Different from Other AI Diagram Tools?: Blog post comparing Visual Paradigm’s AI Chatbot with competing tools.
- Beginner’s Guide to Deployment Diagrams with Visual Paradigm Online: Step-by-step guide for creating deployment diagrams using Visual Paradigm Online.
- Beginner’s Guide to Deployment Diagrams (Duplicate): Additional resource for learning deployment diagrams.
- UML Deployment Diagram: A Definitive Guide to Visualizing Your Infrastructure with AI: Comprehensive guide to using AI for UML deployment diagram creation.
- Enhanced AI Deployment Diagram Generation (Duplicate): Additional reference to enhanced AI features.
- How to Visualize Your System Infrastructure with an AI Deployment Diagram Generator: Tutorial on using AI to visualize system infrastructure.
- AI Development Plan Generator: Information about Visual Paradigm’s AI development plan generation feature.
- Visual Paradigm Official Website: Main website for Visual Paradigm software and tools.
- Visual Paradigm AI Chatbot Interface: Access point for Visual Paradigm’s AI Chatbot for conversational diagram generation and editing.