


In the landscape of software architecture, time is a finite resource. Engineers spend significant portions of their day deciphering how systems interact. The ability to quickly parse visual representations of logic is not just a skill; it is a necessity for maintaining velocity. This guide focuses on Communication Diagrams, a specific type of Unified Modeling Language (UML) interaction diagram. Learning to read these diagrams rapidly allows for faster debugging, more accurate code reviews, and deeper system comprehension.
Complexity often hides in the connections between objects. A single diagram can represent dozens of method calls, state changes, and conditional branches. Without a structured approach, the visual noise becomes overwhelming. By adopting specific scanning techniques, you can extract the essential logic flow in a fraction of the time usually required.
Understanding the Core Structure of Communication Diagrams 🛠️
A Communication Diagram visualizes how objects interact with one another to carry out a specific behavior. Unlike other interaction diagrams that focus heavily on time, this format emphasizes the structural organization of the objects involved. It maps the relationships and the messages passed between them.
To read these efficiently, you must first recognize the fundamental components that make up the visual syntax:
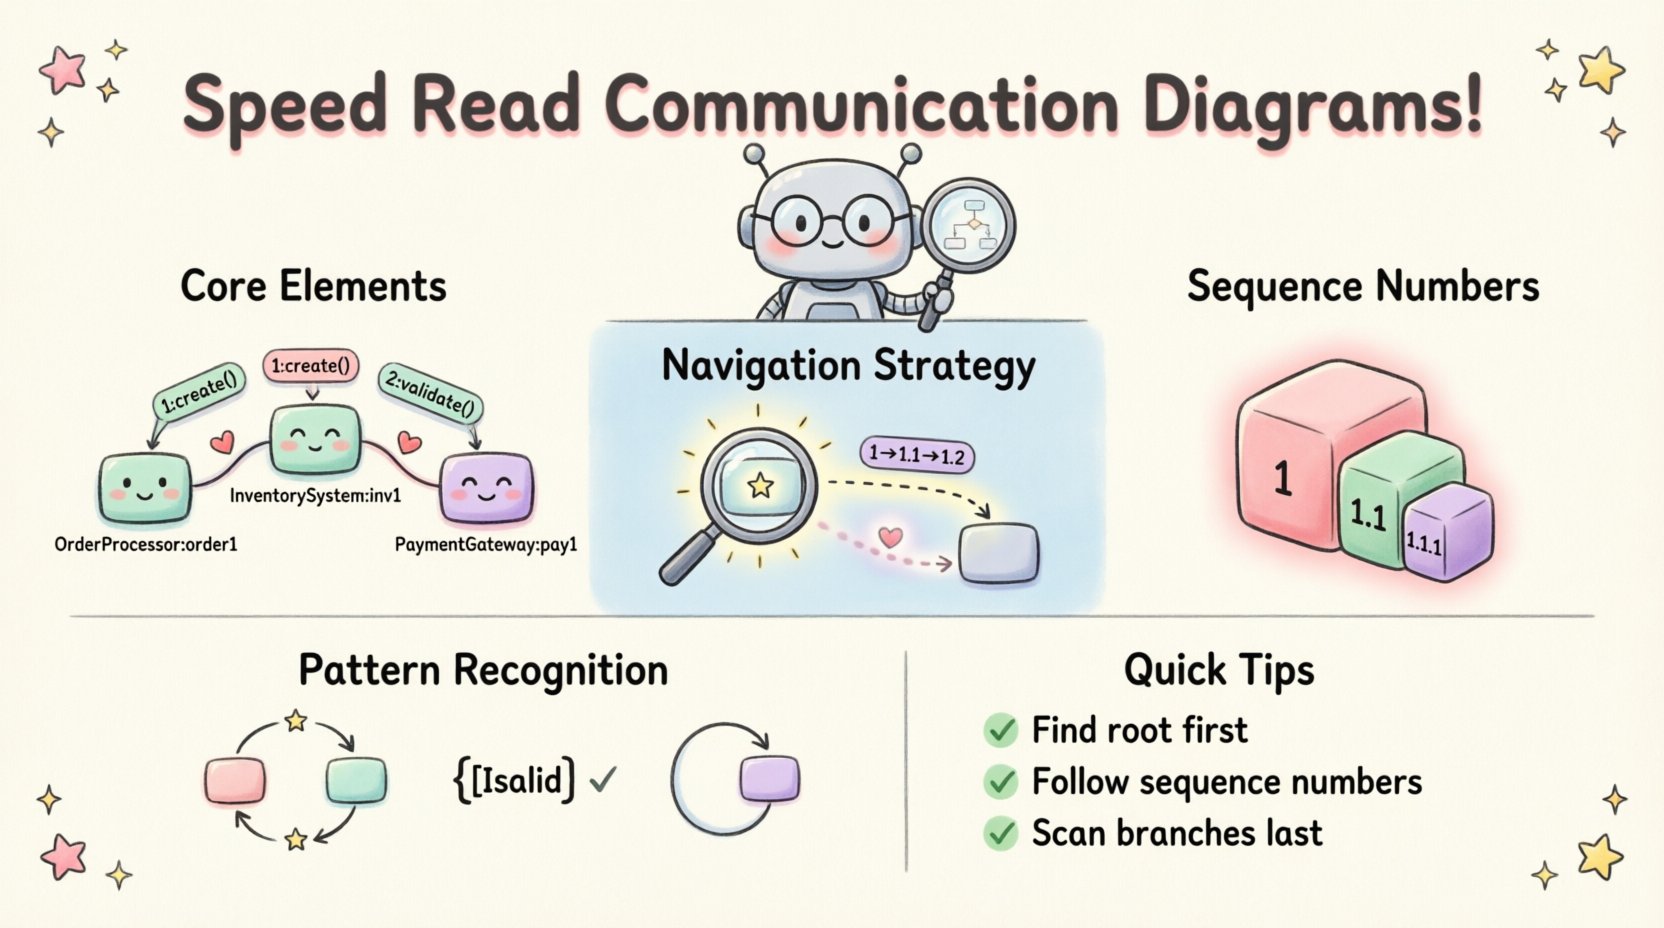
- Object Instances: Represented as rectangles, these are the active participants in the interaction. They are labeled with the class name followed by a colon and an instance name (e.g.,
OrderProcessor: order1). - Links: The lines connecting the object instances. These represent the associations or relationships that allow one object to send a message to another.
- Messages: Arrows indicating the flow of information. They carry method names, parameters, and return values.
- Sequence Numbers: A unique identifier assigned to each message to denote the order of execution.
Recognizing these elements instantly allows you to skip the initial identification phase and move straight to logic analysis.
The Navigation Strategy: Where to Start 👀
When a diagram appears on a screen, the natural instinct is to start at the top left. However, effective speed reading requires a strategic entry point. The goal is to find the entry point of the interaction and follow the primary path before examining the branches.
1. Identify the Root Object
Look for the object that initiates the sequence. This is often the entry point from an external system or the controller layer of the application. It typically has the lowest sequence number (1).
2. Follow the Primary Arrow
Trace the message with the number 1. Follow the path to the next object. This establishes the main thread of execution.
3. Scan for Branching
Once you hit an object, look for outgoing arrows with numbers greater than 1. These represent subsequent actions. Do not get bogged down in the details of every single message immediately. Establish the spine of the flow first.
Decoding the Sequence Numbering System 🔢
The numbering system is the most critical aspect of reading Communication Diagrams quickly. It provides a hierarchical structure that indicates nesting and parallelism. Understanding this hierarchy allows you to predict the flow without reading every label.
- Integer Numbers (1, 2, 3): These represent top-level messages sent from the initial object or parallel actions at the same level of depth.
- Decimal Numbers (1.1, 1.2): These indicate messages sent as a result of the parent message. If message 1 is received by Object A, then 1.1 and 1.2 are actions taken by Object A.
- Double Decimals (1.1.1): These represent deeper nesting. They show a chain of interactions triggered by the previous level.
- Return Messages: Often denoted with dashed lines or specific return notations, though sometimes integrated into the sequence logic. They confirm the completion of the call.
When scanning, group messages by their integer prefixes. If you see a block of messages starting with 2, you know those are independent of the block starting with 1. This mental segmentation reduces cognitive load significantly.
Recognizing Interaction Patterns 🧩
Experienced readers do not look at every line individually. Instead, they look for patterns that signify common software behaviors. Identifying these patterns allows for instant comprehension of the intent.
1. The Recursive Loop
Look for a sequence of messages that returns to a previous object. In a diagram, this often looks like a chain that circles back. This indicates iteration, such as a loop processing a collection of items.
2. The Guard Condition
Messages may have brackets around them, such as [if valid]. These are guard conditions. They indicate that a message is only sent if a specific state exists. When reading, treat these as decision nodes. If the condition is not met, the path terminates.
3. The Self-Call
When an arrow starts and ends at the same object, it represents a method calling itself or a helper method within the same class. This usually implies a calculation or a state update that does not involve external communication.
Communication Diagrams vs. Sequence Diagrams 📊
Confusion often arises between Communication Diagrams and Sequence Diagrams. While both depict interactions, they prioritize different information. Knowing the distinction helps you choose the right mental model for the task.
| Feature | Communication Diagram | Sequence Diagram |
|---|---|---|
| Primary Focus | Object relationships and structure | Time and chronological order |
| Visual Layout | Network-like, spatial arrangement | Vertical timeline with lifelines |
| Message Order | Explicit numbering (1, 1.1) | Top-to-bottom position |
| Complexity | Better for complex object networks | Better for long, linear sequences |
| Interpretation Speed | Faster for structural understanding | Faster for temporal understanding |
When your goal is to understand who talks to whom, the Communication Diagram is often superior. When the goal is when things happen, the Sequence Diagram takes precedence.
Common Interpretation Errors to Avoid ⚠️
Even with a strategy, pitfalls exist. These errors can lead to misinterpreting the system logic and introducing bugs during implementation or review.
- Ignoring the Direction: Always check the arrowhead. A message flows from the tail to the head. Confusing sender and receiver reverses the logic entirely.
- Skipping the Return: In synchronous calls, a return message is implied. Ignoring this can lead to confusion about whether the caller waits for the result. Look for the dashed line or the corresponding return number.
- Overlooking Multiplicity: Objects may represent multiple instances. A link might connect a single object to a collection. Check for multiplicities (e.g.,
1..*) on the links to understand if one object is triggering many others. - Mixing Levels: Do not treat parallel messages (e.g., 2 and 3) as sequential. They can happen simultaneously. Assuming one must finish before the other starts is a common logical error.
Building Mental Models for Faster Processing 🧠
Speed reading is not just about moving your eyes faster; it is about processing information more efficiently. Developing mental models for common architectural patterns accelerates this process.
1. The Request-Response Model
This is the most common pattern. One object sends a request, another processes it, and sends back a response. When you see a tight loop of messages between two objects, assume this pattern first.
2. The Chain of Responsibility
Messages pass from one object to another in a chain until a handler processes them. Look for a linear flow where one object passes the message to a neighbor, who passes it to the next.
3. The Broadcast Pattern
A single object sends a message, and multiple objects receive it. Visually, this looks like one arrow splitting into multiple paths. This often indicates event notification or state synchronization.
By training your brain to recognize these shapes, you reduce the need to read every text label. The shape tells you the behavior.
Practical Application in Code Review and Debugging 📝
The ability to interpret these diagrams rapidly translates directly to tangible improvements in daily workflows. Here is how to apply these skills in real-world scenarios.
1. Validating Implementation
When reviewing code, compare the actual method calls against the diagram. If the diagram shows a message 2.1 going from OrderService to PaymentGateway, but the code does not have this call, the implementation is incomplete.
2. Tracing Exceptions
If a system fails, the diagram helps trace the failure point. Look for the message that was supposed to succeed but didn’t. The numbering system helps you pinpoint exactly where the flow deviated from the expected path.
3. Onboarding New Team Members
Complex systems are hard to explain verbally. A well-structured Communication Diagram provides a visual roadmap. Teaching new engineers to read these diagrams quickly reduces the time they spend asking clarifying questions.
4. Refactoring Safety
Before refactoring a module, review the diagram to understand all dependencies. If you remove a method, check the diagram to see which other objects depend on it. This prevents breaking changes in the broader system.
Developing Your Reading Muscle 💪
Like any technical skill, speed reading diagrams requires consistent practice. There is no shortcut to building the neural pathways required for rapid pattern recognition.
- Start Simple: Begin with diagrams that have fewer than 10 objects. Focus on accuracy before speed.
- Increase Complexity: Gradually move to diagrams with nested loops and multiple branching paths.
- Time Yourself: Set a timer. Give yourself a specific duration to summarize the logic of the diagram. This forces you to prioritize the most important information.
- Verbalize the Flow: As you read, say the steps out loud. “Object A calls Object B, which returns to A.” This reinforces the logical flow.
- Review Old Diagrams: Revisit diagrams you created months ago. You will notice your speed has increased, and you will spot connections you previously missed.
Integrating Diagrams into Debugging 🔎
Debugging is often a process of elimination. Communication diagrams provide a hypothesis map for where things might go wrong.
When an error occurs, do not start in the code. Start in the diagram. Ask yourself:
- Did the message reach the intended recipient?
- Was the return message sent?
- Did a guard condition prevent the message from being sent?
This top-down approach saves time compared to tracing through logs line by line. The diagram gives you the high-level context to understand the logs.
Maintaining Diagram Accuracy 🛡️
A diagram that does not match the code is worse than no diagram at all. It creates false expectations. To ensure your diagrams remain useful for speed reading, maintain their fidelity.
- Update During Changes: If the code changes the interaction flow, update the diagram immediately.
- Remove Dead Ends: If a path is no longer used in the code, remove it from the diagram to reduce visual noise.
- Standardize Notation: Ensure the team agrees on how to represent specific patterns (e.g., how to show a timeout or a retry). Consistency speeds up interpretation.
The Impact of Visual Literacy on System Design 🏗️
Designers who can quickly interpret diagrams make better architectural decisions. They can see the ripple effects of a change before writing a single line of code. This foresight reduces technical debt.
When you can read a diagram in seconds, you can evaluate multiple design alternatives in the time it usually takes to discuss one. This agility is a competitive advantage in software development. It shifts the focus from documentation maintenance to value creation.
Summary of Best Practices ✅
To conclude the practical application of these techniques, here is a checklist for your next review session:
- Locate the root object first.
- Read the sequence numbers to establish hierarchy.
- Identify the primary flow before the branches.
- Look for guard conditions and loops.
- Verify the direction of all arrows.
- Compare the diagram against the current code state.
By adhering to these practices, you transform a static image into a dynamic understanding of system behavior. The complexity of the diagram does not change, but your ability to navigate it does. This shift is what separates a junior engineer from a senior architect.
Final Thoughts on Efficiency 📈
Technical documentation is often seen as a burden. However, when read correctly, it is a high-bandwidth channel for information transfer. Communication Diagrams, in particular, offer a dense summary of interactions that text descriptions cannot match.
Investing time in learning to read these diagrams efficiently pays dividends in reduced meeting times, fewer bugs, and clearer communication across teams. The goal is not to memorize every diagram, but to develop a framework for understanding them on the fly. As you practice, the time it takes to interpret these visuals will decrease, allowing you to focus more on solving problems and less on deciphering the map.