


Strategic planning often feels like navigating a ship through fog. Without a clear view of the surrounding waters, you risk colliding with unseen obstacles. The Five Forces Analysis provides the clarity needed to see the competitive landscape. Originally developed by Michael Porter, this framework remains a cornerstone for understanding industry profitability and competitive intensity.
This guide offers a streamlined approach to executing this analysis efficiently. You do not need weeks of research to gain valuable insights. With focused effort, you can assemble a strategic snapshot in under half an hour. This document breaks down the mechanics, the execution steps, and the interpretation required to make informed decisions.
🧐 What Is the Five Forces Framework?
The Five Forces model evaluates the competitive environment of an industry. It moves beyond simple competitor tracking to examine the underlying economic forces that shape profit potential. Instead of asking “Who is my competitor?”, it asks “Why is this industry profitable or unprofitable?”.
By understanding these forces, organizations can identify where the power lies. Power dictates margin. If buyers hold power, they drive prices down. If suppliers hold power, they drive costs up. The goal of this analysis is to locate these pressure points before committing resources.
🏗️ The Core Components
The framework consists of five specific dimensions. Each dimension represents a source of pressure on industry profitability.
- Threat of New Entrants: How easy is it for new companies to enter the market?
- Bargaining Power of Suppliers: How much control do providers have over prices?
- Bargaining Power of Buyers: How much leverage do customers have to demand lower prices?
- Threat of Substitute Products: Can customers solve their problem using a different method?
- Rivalry Among Existing Competitors: How intense is the competition between current players?
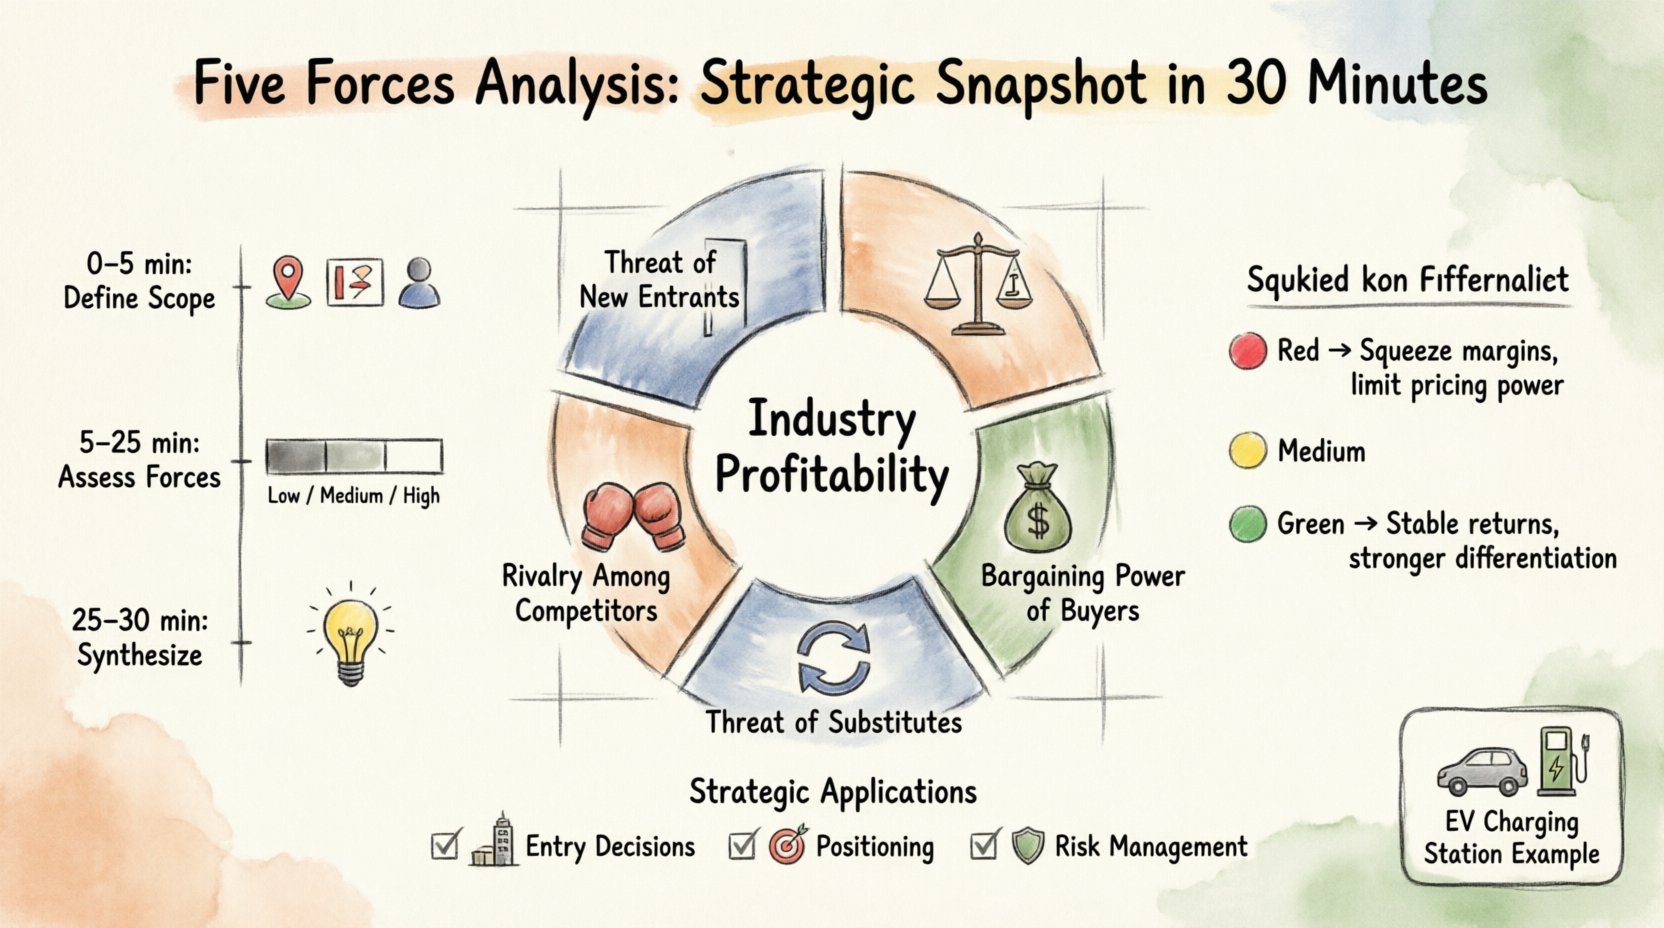
⚙️ Step-by-Step: The 30-Minute Workflow
Conducting a full-scale industry study takes months. However, a “Quick Start” version focuses on the most critical data points. This workflow assumes you have basic market knowledge. If you lack this, spend the first few minutes gathering high-level intel.
Minutes 0-5: Define Scope
Clarity begins with boundaries. You cannot analyze the entire global economy in one session. Define the specific market segment you are evaluating.
- Geography: Is this local, national, or global?
- Segment: Are you looking at premium, budget, or mid-range?
- Customer: Who is the end-user?
Write this down clearly. This prevents scope creep during the analysis.
Minutes 5-25: Assess the Forces
This is the core of the session. Dedate four minutes to each force. Use a scoring system from Low to High to represent the intensity of the force. Focus on gathering evidence, not just opinions.
1. Threat of New Entrants 🚪
Consider the barriers to entry. High barriers protect incumbents. Low barriers invite disruption.
- Capital Requirements: How much money is needed to start?
- Regulations: Are there licenses or permits required?
- Technology: Is the tech proprietary or commoditized?
- Brand Loyalty: Do customers stick to existing names?
If the answer is “low cost, low tech, no regulations,” the threat is High. If it requires billions and patents, the threat is Low.
2. Bargaining Power of Suppliers ⚖️
Suppliers influence your costs. If they can raise prices without losing customers, they have power.
- Number of Suppliers: Is there a monopoly or many options?
- Switching Costs: Is it hard to change providers?
- Differentiation: Are inputs unique or standard?
- Forward Integration: Can suppliers become your competitor?
Single-source suppliers with unique materials create High power. Commodity markets with many vendors create Low power.
3. Bargaining Power of Buyers 💰
p>Buyers influence your revenue. If they can demand lower prices or better service, they have power.- Concentration: Are there a few large buyers or many small ones?
- Volume: Do they buy in bulk?
- Price Sensitivity: Is the product a small part of their budget?
- Backward Integration: Can buyers make the product themselves?
Large corporate clients buying in volume exert High power. Individual consumers buying single units exert Low power.
4. Threat of Substitutes 🔄
Substitutes limit your pricing ceiling. If a customer can solve the problem differently, they will not pay a premium.
- Performance: Does the substitute work as well?
- Price: Is the substitute cheaper?
- Switching Effort: Is it easy to change methods?
- Convenience: Is the substitute more accessible?
Consider how a customer solves the problem, not just the product. A train is a substitute for a plane, even if it is slower. High substitution threat caps your revenue potential.
5. Rivalry Among Existing Competitors 🥊
This is the most visible force. It defines the daily grind of the industry.
- Number of Competitors: Is the market fragmented or consolidated?
- Industry Growth: Is the pie growing or shrinking?
- Product Differentiation: Are products identical or unique?
- Exit Barriers: Is it hard to leave the industry?
Slow growth and high fixed costs usually lead to intense rivalry. Price wars become common. Fast growth allows for coexistence.
Minutes 25-30: Synthesize and Score
Review your notes. Assign a final rating to each force: High, Medium, or Low. This creates a visual map of the industry’s profitability.
📊 Interpreting Your Strategic Snapshot
Once the analysis is complete, the data needs context. Use the table below to interpret your findings.
| Force | High Intensity Impact | Low Intensity Impact |
|---|---|---|
| New Entrants | Price erosion, loss of market share | Stable pricing, protected margins |
| Supplier Power | Increased cost of goods sold | Lower input costs, flexible sourcing |
| Buyer Power | Price pressure, demand for features | Ability to command premium pricing |
| Substitutes | Market shrinkage, innovation pressure | Customers remain loyal to solution |
| Rivalry | Marketing spend wars, margin compression | Cooperative pricing, niche focus |
High Overall Intensity: The industry is unattractive. Profits are likely to be low. Strategy should focus on cost leadership or differentiation to survive.
Low Overall Intensity: The industry is attractive. Profits are likely to be high. Strategy should focus on protecting position and scaling.
🛠️ Gathering Data Without Software
You do not need expensive analytics platforms to gather this information. Use free and accessible resources to validate your assumptions.
Primary Sources
- Customer Interviews: Ask buyers why they choose you or your rivals.
- Supplier Conversations: Discuss pricing trends and availability.
- Job Postings: Analyze hiring trends to see where competitors are investing.
- Annual Reports: Review public filings for competitor financial health.
Secondary Sources
- Trade Associations: Look for industry statistics and reports.
- News Archives: Search for recent mergers, acquisitions, or scandals.
- Government Databases: Check for regulatory changes or import/export data.
- Social Media: Monitor customer complaints and praise on public forums.
⚠️ Common Pitfalls to Avoid
Even a quick analysis can go off track. Be aware of these common errors to maintain accuracy.
- Defining the Industry Too Broadly: Analyzing “Food” is useless. Analyzing “Organic Baby Food in the UK” is actionable.
- Ignoring Complements: Sometimes products work together (e.g., printers and ink). If the complement is weak, your product suffers.
- Assuming Static Conditions: Markets change. What is true today may be false next year. Note the date of your analysis.
- Overlooking Global Supply Chains: A local competitor might not matter if imports flood the market.
- Confusing Competitors with Substitutes: A rival sells the same product. A substitute solves the problem differently.
🔗 Integrating into Broader Strategy
Once you have the snapshot, how do you use it? This analysis informs three key strategic areas.
1. Entry Decisions
Should you enter the market? If the Five Forces indicate High intensity, the risk of failure is elevated. If the forces are weak, the barrier to profit is lower. This analysis validates or invalidates the entry hypothesis.
2. Positioning
Where do you fit? If Buyer Power is High, you must offer something unique to reduce their leverage. If Supplier Power is High, you must secure long-term contracts or find alternatives. The forces dictate where you must defend and where you can attack.
3. Risk Management
Identify where the threats lie. If New Entrants are a High threat, invest in brand loyalty. If Substitutes are a High threat, invest in R&D. This allows for proactive rather than reactive planning.
📝 Checklist for Execution
Use this checklist to ensure you have covered the essentials during your session.
- ☐ Defined the specific market scope
- ☐ Identified the top 3 competitors
- ☐ Mapped the supply chain
- ☐ Identified potential substitute technologies
- ☐ Assessed capital requirements for entry
- ☐ Scored each force (Low/Medium/High)
- ☐ Documented data sources used
- ☐ Identified top 3 strategic implications
💡 Real-World Application Example
Consider a hypothetical scenario: A company planning to launch a new electric vehicle charging network.
- New Entrants: High. Tech is available, but land acquisition is hard. Score: Medium.
- Suppliers: Medium. Battery tech is consolidating, but cable manufacturers are many. Score: Medium.
- Buyers: High. Car owners are price-sensitive and have many apps to compare. Score: High.
- Substitutes: High. Public transit, gas vehicles, or home charging exist. Score: High.
- Rivalry: High. Major energy companies and startups are fighting for spots. Score: High.
Conclusion for Example: The industry is hostile. The strategy must focus on exclusive partnerships with automakers to lock in buyers, reducing their power.
🔄 Continuous Monitoring
A 30-minute analysis is a snapshot, not a movie. Industry dynamics shift. New technologies emerge, regulations change, and consumer habits evolve. Revisit this framework periodically.
- Quarterly Review: Check for shifts in supplier contracts or competitor pricing.
- Annual Review: Re-score the forces to track long-term trends.
- Event-Driven: Trigger a new analysis after a major acquisition or regulatory change.
Strategic agility depends on accurate information. The Five Forces Analysis provides the foundation for that information. By following this structured approach, you gain a clear view of the competitive terrain without getting lost in unnecessary detail.
🏁 Final Thoughts
Complexity is the enemy of action. This framework simplifies a complex problem into five manageable questions. It forces you to look beyond your immediate competitors and consider the economic forces that drive the market.
Use this tool to validate your assumptions. Use it to challenge your strategy. Use it to find the opportunities hidden in the gaps of the competitive landscape. With a clear understanding of these forces, you can navigate the market with confidence and precision.