


Imagine opening a technical document and immediately hitting a wall of symbols. You are looking at a package diagram intended to explain the high-level structure of a software system. Instead of clarity, you see a dense web of arrows, stereotypes, and nested boxes that look more like a circuit board than a roadmap. This is a common scenario in modern software development. Many teams fall into the trap of believing that more detail equals better documentation. However, the reality is often the opposite. When the underlying system is straightforward, complex notations introduce unnecessary friction.
The goal of architecture documentation is to communicate intent, not to display every single relationship. This article explores why simplifying package diagrams can lead to better maintenance, clearer communication, and faster decision-making. We will examine when complexity is necessary and when it is merely an obstacle.
🧐 Understanding the Package Diagram Context
A package diagram serves as a structural blueprint. It groups related classes, modules, or subsystems into logical containers. These containers help developers understand where code belongs and how different parts of the system interact. In many modeling standards, packages can have specific properties, dependencies, and relationships. The temptation is to use every available tool to describe these relationships.
However, the purpose of the diagram dictates the level of detail. If the diagram is meant for a high-level overview, intricate notations are distracting. If it is meant for a detailed implementation guide, it might require more precision. The key is alignment between the audience and the artifact.
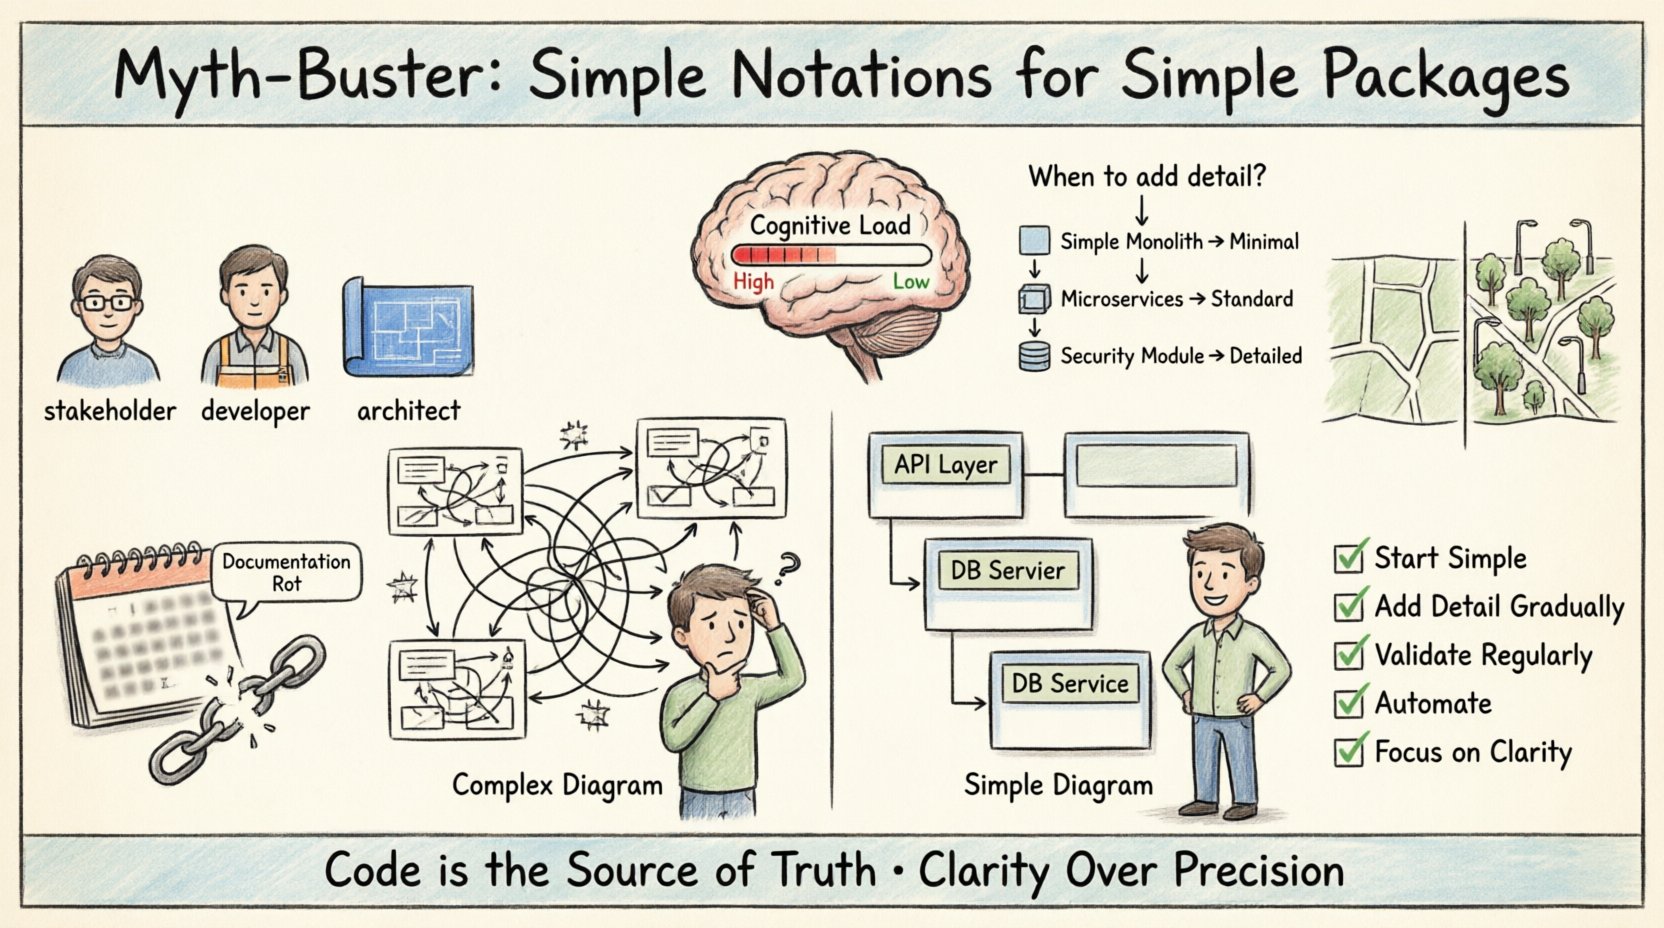
- High-Level Audience: Stakeholders, product managers, and new hires need a clear view of boundaries.
- Technical Audience: Developers need to know how modules connect, but not necessarily every internal dependency.
- Architectural Audience: Leads need to see constraints and patterns, not just connections.
When you tailor the diagram to the audience, you reduce the cognitive load required to understand the system. Over-engineering the notation often alienates the very people you are trying to inform.
⚠️ The Myth of Complexity Equals Precision
There is a persistent belief in some technical circles that a diagram must look complicated to be accurate. This is a myth. A simple box with a clear label is often more accurate than a box filled with dependencies if the system itself is not changing rapidly. Complexity in notation does not equate to complexity in reality.
When developers add stereotypes to every package, they are often trying to capture details that belong in the code, not the diagram. Code is the source of truth. The diagram is a map. A map does not need to show every tree; it needs to show the roads. If you draw every tree, the map becomes unreadable.
Consider the following reasons why teams often overcomplicate their package diagrams:
- Fear of Missing Information: Worrying that a stakeholder will ask a question the diagram doesn’t answer.
- Tool Capabilities: Using a tool that allows complex features and feeling the need to utilize them.
- Perfectionism: Trying to make the diagram perfect before sharing it with anyone.
- Legacy Habits: Following patterns from previous projects that were more complex than the current one.
Each of these reasons leads to documentation that is expensive to maintain and difficult to read. Simplicity is not a lack of effort; it is the result of thoughtful curation.
🧠 Cognitive Load and Diagram Readability
Cognitive load refers to the total amount of mental effort being used in the working memory. When a developer looks at a diagram, their brain processes the visual elements. If there are too many arrows, colors, and symbols, the brain spends energy decoding the visual language rather than understanding the system architecture.
Simple notations reduce this load significantly. A standard dependency arrow is universally understood. A complex stereotype icon requires context. If that context is not immediately available, the reader must pause and investigate. This pause breaks the flow of thought and reduces productivity.
Factors Increasing Cognitive Load
- Visual Clutter: Too many lines crossing over each other.
- Non-Standard Symbols: Using icons that are not standard UML or industry conventions.
- Excessive Nesting: Packages containing other packages containing other packages.
- Detailed Constraints: Writing text constraints directly on the lines.
By stripping away the non-essential, you allow the reader to focus on the actual structure. A clean diagram signals that the system is well-organized. A messy diagram signals that the system might be confused.
📊 When to Keep It Simple vs. When to Add Detail
Not every system requires the same level of abstraction. Some applications are monolithic with clear boundaries. Others are distributed microservices with complex communication patterns. The decision to add notation complexity should be based on the specific needs of the project.
Below is a framework to help determine the appropriate level of detail for your package diagrams.
| Scenario | Recommended Notation Level | Reasoning |
|---|---|---|
| Simple Monolith | Minimal | Boundaries are clear. Dependencies are standard. Extra symbols add noise. |
| Microservices | Standard | Focus on service boundaries and communication protocols (HTTP, gRPC). |
| Legacy System Refactor | Descriptive | Needs to capture existing logic to guide migration without confusion. |
| Internal Library | Minimal | Consumers need to know how to import, not how the internal classes interact. |
| Security Critical Module | Detailed | Needs to show trust boundaries and data flow explicitly. |
| Public API | Interface Focused | Focus on exposed endpoints, not internal implementation logic. |
Using this table, you can make objective decisions about your documentation. If your scenario fits the “Minimal” or “Standard” rows, resist the urge to add complex stereotypes. Save the detail for the code comments or specific design documents.
🔗 Managing Dependencies Without the Noise
Dependencies are the lifeblood of software architecture. They show how one package relies on another. However, showing every single dependency can create a “spaghetti diagram.” This is visually overwhelming and offers little value for understanding the high-level flow.
Focus on the critical dependencies that define the system’s boundaries. Ignore internal class-level dependencies unless they cross package boundaries in a significant way.
- Use Aggregation: Group related dependencies under a single relationship line if possible.
- Hide Implementation: Do not show dependencies on internal classes unless they are public APIs.
- Focus on Entry Points: Highlight where data enters the system and where it exits.
- Layer Separation: Clearly distinguish between presentation, business logic, and data access layers.
By filtering dependencies, you highlight the architecture’s structure rather than its implementation details. This distinction is vital for long-term maintainability.
🛠️ The Maintenance Burden of Complex Notation
Documentation is a living artifact. It requires updates whenever the code changes. Complex notations increase the time and effort required to keep the diagram in sync with the codebase. Every time you refactor a class, you might need to update a stereotype. Every time you add a dependency, you might need to adjust a constraint label.
This maintenance cost often leads to documentation rot. Teams stop updating the diagrams because they are too hard to maintain. Once the diagrams are outdated, they become misleading. Misleading documentation is worse than no documentation at all, as it creates a false sense of security.
Signs Your Diagrams Are Too Complex to Maintain
- Updates are Rare: The last update was months ago despite active development.
- Confusion on Changes: Developers are unsure if the diagram reflects the current state.
- Tooling Overhead: The tool requires complex configuration to render the diagram.
- Manual Drawing: Diagrams are drawn manually rather than generated from code.
To combat this, adopt a philosophy of “just enough” documentation. If a change does not affect the high-level package structure, do not update the diagram. Let the code be the primary source of truth for implementation details.
🗣️ Communication vs. Specification
There is a fundamental difference between communicating architecture and specifying it. Specification implies a contract that must be followed exactly. Communication implies a shared understanding of concepts. Package diagrams are primarily for communication.
When you write a specification, you need precision. When you communicate, you need clarity. Most package diagrams fall into the communication category. Therefore, they should prioritize clarity over precision.
Ask yourself these questions before adding a notation:
- Does this symbol help someone understand the flow?
- Can this be explained verbally if the diagram is simple?
- Is this information available in the code anyway?
- Will removing this symbol change the meaning?
If the answer to the last question is no, remove the symbol. If the answer to the second question is yes, remove the diagram and use a conversation.
🔄 Iterative Modeling and Evolution
Architecture does not happen in a single step. It evolves over time. Your package diagram should evolve with the system. Starting with a simple diagram allows you to add complexity only when the system demands it.
Begin with a high-level view. As the system grows, add layers of detail to specific areas that become complex. Do not try to predict every future complexity. This approach prevents the initial overhead of creating a massive diagram that will never be used.
- Phase 1: Define the main modules and their boundaries.
- Phase 2: Clarify the dependencies between modules.
- Phase 3: Add detail to modules that are unstable or changing frequently.
- Phase 4: Refine the diagram based on feedback from the team.
This iterative process ensures that the diagram remains relevant. It also allows the team to focus on the current problem rather than hypothetical future scenarios.
📉 The Impact on Onboarding New Developers
Onboarding is one of the most critical times for architecture documentation. New developers need to understand the system quickly to become productive. A complex package diagram can be a barrier to entry.
If a new hire has to learn a custom notation system before they can understand the package structure, their ramp-up time increases. They might spend weeks deciphering a diagram instead of weeks writing code. Simple diagrams reduce this friction.
Benefits of Simple Diagrams for Onboarding
- Faster Orientation: New hires grasp the system structure in hours, not days.
- Reduced Anxiety: Clear visuals reduce the fear of breaking the system.
- Better Context: Understanding the “what” and “where” comes before the “how”.
- Self-Sufficiency: Developers can find their own way through the codebase.
Investing in simple, clean diagrams pays dividends in team velocity. It is an investment in human capital, not just technical artifacts.
🔍 Code as the Source of Truth
It is essential to remember that code is the source of truth. Diagrams are representations. If the code changes and the diagram does not, the diagram is wrong. Relying on complex diagrams to define behavior is risky.
Encourage a culture where the code is trusted over the documentation. If the package structure changes, the diagram should be updated automatically or regenerated. If manual updates are required, keep them minimal. This reduces the likelihood of the diagram becoming obsolete.
Use tools that can generate diagrams from code where possible. This ensures that the visual representation always matches the actual implementation. If you must draw manually, limit the scope to the high-level structure.
🌐 Standardizing Notation for Consistency
Even if you choose simplicity, consistency is key. If every developer uses a different set of symbols, the diagrams will be inconsistent. Standardizing on a minimal set of notations helps everyone understand the system.
- Define a Legend: If you use a non-standard symbol, document it clearly.
- Limit Colors: Use color only to highlight specific states or issues, not to differentiate every package.
- Uniform Shapes: Use rectangles for packages, circles for external systems, and so on.
- Clear Labels: Ensure all labels are concise and descriptive.
Consistency reduces the learning curve for anyone reading the diagram. It creates a shared language within the team.
🚀 Future Proofing Your Documentation
Technology changes. Tools change. Standards change. A diagram that is too tied to a specific tool or notation might become obsolete quickly. By sticking to standard, simple notations, you ensure longevity.
Standard UML package diagrams, for example, have been around for decades. They are widely understood. Custom notations might be useful today but could be confusing in five years. Stick to the basics to ensure your documentation remains readable over time.
🤝 Aligning Team Expectations
Finally, ensure the whole team agrees on the level of detail required. Sometimes architects want detail, while developers want simplicity. This conflict can lead to friction. Establish a shared understanding of what the diagram is for.
Hold discussions about the documentation strategy. Ask the team what they need from the diagrams. If they say they just need to know the boundaries, then do not draw the dependencies. If they say they need to know the data flow, then focus on that. Listen to the consumers of the documentation.
📝 Summary of Best Practices
To summarize, the path to effective package diagrams lies in restraint. Avoid the temptation to document everything. Focus on the structure that matters for the current context. Use standard notations where possible. Keep the maintenance burden low. Prioritize the reader’s experience over the creator’s desire for detail.
- Start Simple: Begin with the minimum viable diagram.
- Add Detail Gradually: Only add complexity when the system requires it.
- Validate Regularly: Check if the diagram is still useful.
- Automate Where Possible: Reduce manual updates.
- Focus on Clarity: Ensure the message is clear to the intended audience.
By following these principles, you create documentation that supports your team rather than hindering it. You build a foundation for sustainable development where clarity reigns supreme.