


Introduction: Bridging the Gap Between Software Design and Real-World Deployment
As a software architect who has spent years wrestling with the challenge of translating elegant code designs into robust, deployable systems, I’ve learned that the hardest part of development isn’t always writing the code—it’s ensuring that code runs reliably across complex hardware and network topologies. Early in my career, I struggled with deployment planning, often discovering critical infrastructure mismatches only during late-stage testing. That’s when I discovered UML deployment and component diagrams, and more specifically, Visual Paradigm’s implementation of these powerful modeling tools.

This guide shares my practical experience using Visual Paradigm Online to create deployment and component diagrams. Whether you’re a seasoned architect or a developer just starting to think about system topology, I hope my journey—from initial confusion to confident modeling—helps you visualize, plan, and execute your system deployments with greater clarity and fewer surprises.
What I Learned: Deployment Diagrams Demystified
In the UML, you use class diagrams and component diagrams to reason about the structure of your software. You use sequence diagrams, collaboration diagrams, statechart diagrams, and activity diagrams to specify the behavior of your software. At the edge of your system’s software and hardware, you use deployment diagrams to reason about the topology of processors and devices on which your software executes.
What is a Deployment Diagram in UML? (From My Perspective)
When I first encountered deployment diagrams, I thought they were just “fancy network maps.” Boy, was I wrong. In the UML, deployment diagrams are used to visualize the static aspect of these physical nodes and their relationships and to specify their details for construction. Deployment diagrams are one of the two kinds of diagrams used in modeling the physical aspects of an object-oriented system. A deployment diagram shows the configuration of run time processing nodes and the components that live on them. Deployment diagrams address the static deployment view of an architecture. They are related to component diagrams in that a node typically encloses one or more components.
What clicked for me was realizing: deployment diagrams answer the question “Where does my code actually run?”
Class vs Node vs Component: Clearing the Confusion
Component diagrams and deployment diagrams are similar to class diagrams, except that instead of containing classes, they contain components and nodes, respectively. Deployment diagrams are essentially class diagrams that focus on a system’s nodes. You use deployment diagrams to model the static deployment view of a system. For the most part, this involves modeling the topology of the hardware on which your system executes.
We typically use classes to model the concepts and things in a problem domain, and subsequently, we can model them with concrete instances using components and nodes. For example, if you want to model the topology of your organization’s network, you’ll use deployment diagrams containing instances of nodes. Similarly, if you want to model the components that live on the physical nodes in this network, you’ll use component diagrams containing instances of the components.
My First Try: Getting Started with Visual Paradigm Online
Finding an online Deployment Diagram tool? Just click the Draw button below to create your Deployment Diagram online. Visual Paradigm Online is free* and intuitive. You can also go through this Deployment Diagram tutorial to learn about Deployment Diagram before you get started.
Deployment Diagram Notations: What Each Symbol Actually Means (After Using Them)
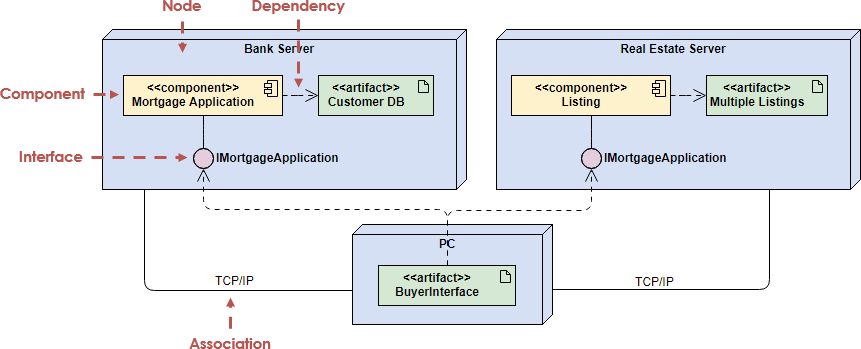
Component
A component is a grouping of classes that work together closely. Components can be classified by their type. Some components exist only at compile time, some exist only at link time, some exist only at run time; and some exist at more than one time.
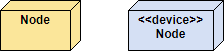
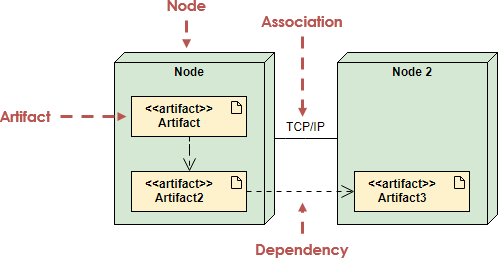
Node
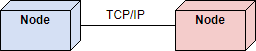
A node is a run-time physical object that represents a computational resource, generally having memory and processing capability. You can model node types and node instances. You may model the component instances that run or live on a node by drawing them within the node. You may model which nodes communicate with one another using the Connection relationship line.
Dependency
A dependency indicates that one model element (source) depends on another model element (target), such that a change to the target element may require a change to the source element in the dependency. In a deployment diagram, you can use the dependency relationship to show the capability of a node type to support a component type. You may also use the relationship to show the dependency between component types.
Connection
A connection depicts the communication path used by the hardware to communicate usually indicates the method i.e. TCP/IP.
Artifact
Artifacts represent concrete elements in the physical world that are the result of a development process. Examples of artifacts are executable files, libraries, archives, database schemas, configuration files, etc.
When I Actually Used Deployment Diagrams (Real-World Scenarios)
When you model the static deployment view of a system, you’ll typically use deployment diagrams in one of three ways.
1. To model embedded systems
-
A collection of hardware that interfaces with the physical world.
-
A set of controls devices such as motors, actuators, and displays.
-
A set of external stimuli such as sensor input, movement, and temperature changes.
-
You can use deployment diagrams to model the devices and processors that comprise an embedded system.
2. To model client/server systems
-
A client/server system is a common architecture focused on making a clear separation of concerns between the system’s user interface (which lives on the client) and the system’s persistent data (which lives on the server).
-
A Client/server systems are about the physical distribution of your system’s software components across the nodes.
-
You can model the topology of such systems by using deployment diagrams.
3. To model fully distributed systems
-
A distributed systems are often hosts to multiple versions of software components, some of which may even migrate from node to node.
-
A distributed systems requires you to make decisions that enable the continuous change in the system’s topology.
-
You can use deployment diagrams to visualize the system’s current topology and distribution of components to reason about the impact of changes on that topology.
How I Actually Drew My First Deployment Diagram (Step-by-Step)
A Deployment model can be developed by following the steps below.
-
Firstly, identify the nodes that represent your system’s client and server processors and then highlight those devices that are relevant to the behavior of your system.
For example, you’ll want to model special devices, such as credit card readers, badge readers, and display devices other than monitors, because their placement in the system’s hardware topology are likely to be architecturally significant.
-
Provide visual cues for these processors and devices via stereotyping.
-
Model the topology of these nodes in a deployment diagram.
-
Similarly, specify the relationship between the components in your system’s implementation view and the nodes in your system’s deployment view.
Deployment Planning: Questions I Wish I’d Asked Earlier
A Deployment model can be developed by following the steps below.
-
Design and plan how will your system be installed?
-
Determine if different versions of the system will be deployed at the same time, how will you resolve differences?
-
What physical sites do you need to deploy to and in what order?
-
How will you train your users?
-
What backups do you need before installation?
Deployment Diagram Examples That Actually Helped Me
A component is a code module. Component diagrams are physical analogs of class diagram. Deployment diagrams show the physical configurations of software and hardware. The following deployment diagram shows the relationships among software and hardware components involved in real estate transactions.
The physical hardware is made up of nodes. Each component belongs on a node. Components are shown as rectangles with two tabs at the upper left.
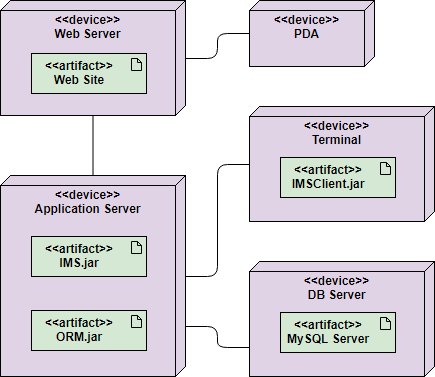
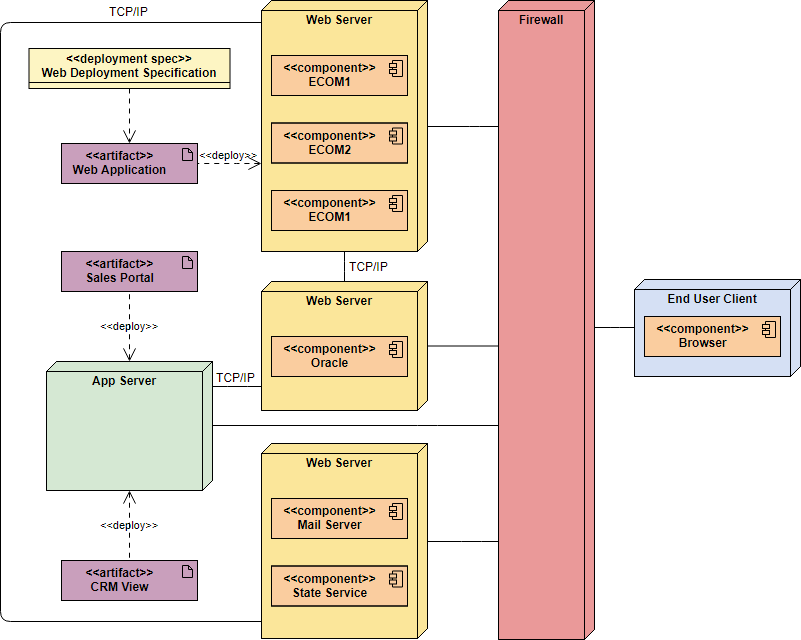
The Deployment Diagram example below shows a Management Information System for a SME which use TCP/IP as network communication protocol for connecting between the web server database, application, email servers and etc. protected by a firewall between the client and server side of the system.
More Class Diagram examples:
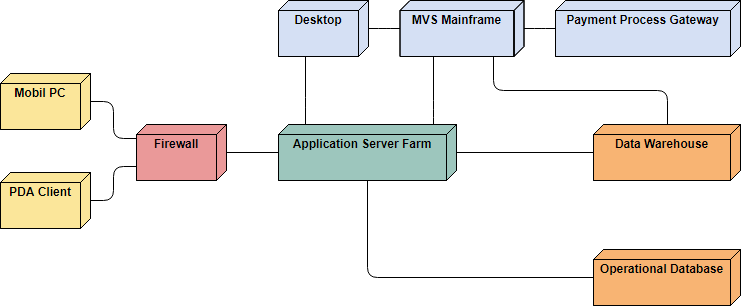
Deployment Diagram Example – Corporate Distributed System
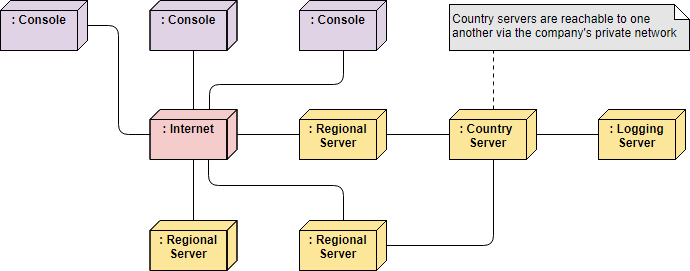
Deployment Diagram Example – Modeling a Distributed System
Component Diagram Tutorial: My Modular Design Breakthrough
Component diagrams provide a simplified, high-order view of a large system. Classifying groups of classes into components supports the interchangeability and reuse of code. This diagram documents how these components are composed and how they interact in a system.
What is a Component Diagram in UML? (Why It Changed My Approach)
The main purpose of a component diagram is to show the structural relationships between the components of a system. In UML, Components are made up of software objects that have been classified to serve a similar purpose. Components are considered autonomous, encapsulated units within a system or subsystem that provide one or more interfaces. By classifying a group of classes as a component the entire system becomes more modular as components may be interchanged and reused. Component diagrams document the encapsulation of the component and the means by which the component interacts via interfaces.
What transformed my workflow was understanding: component diagrams answer “How do my software modules interact?”
Try it!
Finding an online Component Diagram tool? Just click the Draw button below to create your Component Diagram online. Visual Paradigm Online is free* and intuitive. You can also go through this Component Diagram tutorial to learn about Component Diagram before you get started.
Component Diagram Notations: Symbols That Made Sense After Practice
Component
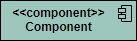
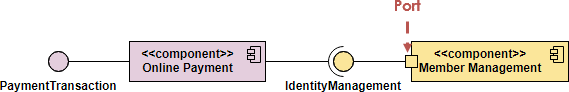
A component is drawn as a rectangle with optional compartments stacked vertically. A component can be represented as just a rectangle with the component’s name and the component stereotype text and/or icon. The component stereotype’s text is “<<component>>” and the component stereotype icon is a rectangle with two smaller rectangles protruding on its left side.
Component Interfaces
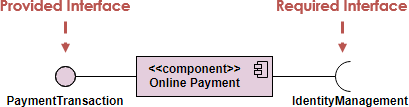
Provide Interface
Provided interfaces define “a set of public attributes and operations that must be provided by the classes that implement a given interface”.
Required Interface
Required interfaces define “a set of public attributes and operations that are required by the classes that depend upon a given interface”.
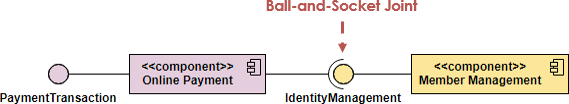
Component Assemblies
Components can be “wired” together using to form subsystems, with the use of a ball-and-socket joint.
Port
A port (definition) indicates that the component itself does not provide the required interfaces (e.g., required or provided). Instead, the component delegates the interface(s) to an internal class.
When I Actually Drew Component Diagrams (Practical Use Cases)
-
Use component diagrams when you are dividing your system into components and want to show their interrelationships through interfaces.
-
The breakdown of components into a lower-level structure.
How I Actually Drew a Component Diagram (My Workflow)
-
Decide on the purpose of the diagram
-
Add components to the diagram, grouping them within other components if appropriate
-
Add other elements to the diagram, such as classes, objects and interface
-
Add the dependencies between the elements of the diagram
You can also:
-
Draw subsystems for logical categorization of components

Component Diagram Examples That Solved Real Problems for Me
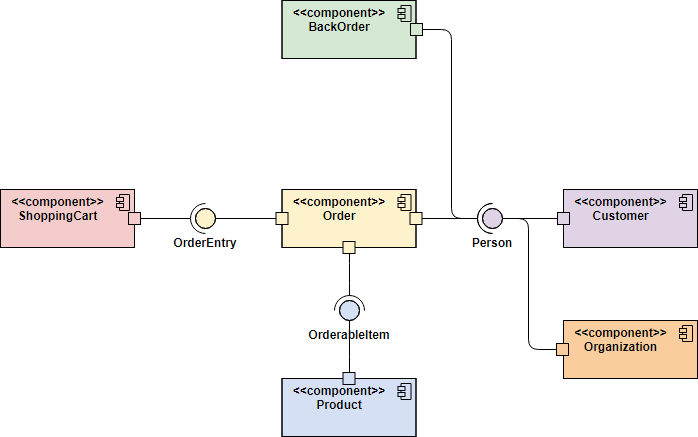
Order Processing System Component diagram example
One main benefit of Component diagrams if to simplify the high-level view of the system. The Figure below is a much larger view of what is involved in a online store. By using a component diagram we see the system as a group of nearly independent component or subsystems that interact with each other in a specifically defined way.
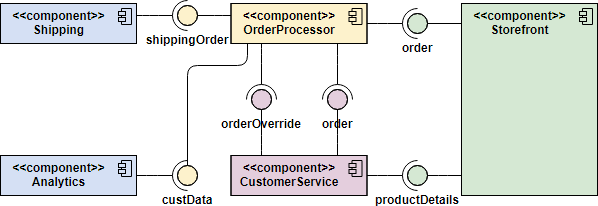
Each component is responsible for the action for which it is named and interface(s) it provides. As long as those requirements are maintained changes to one component will not percolate to other components.
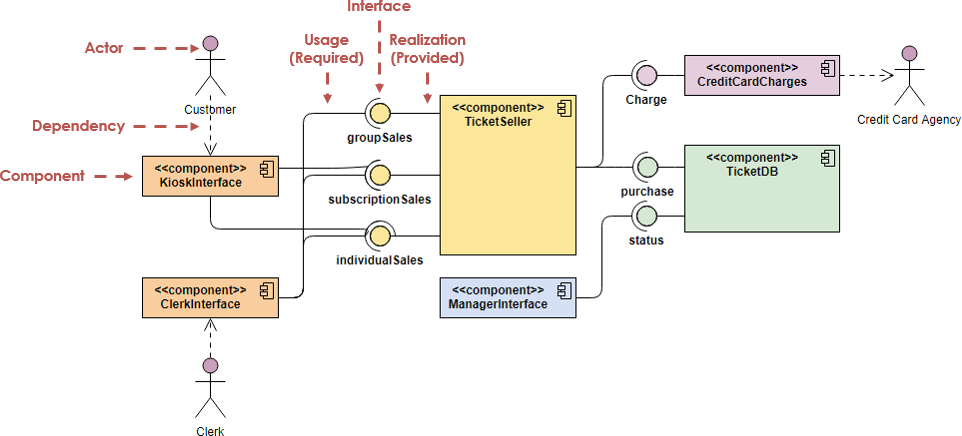
Ticket Selling System Component Diagram Example
There is a ticket seller component that sequentializes requests from both ticket selling system and clerks. A component that processes credit card charges; and the database containing the ticket information.
Component Example – Store Component – nested component structure
To show a nested component structure, you merely draw the component larger than normal and place the inner parts inside the name compartment of the encompassing component. The Figure below show’s the Store’s component nested structure.
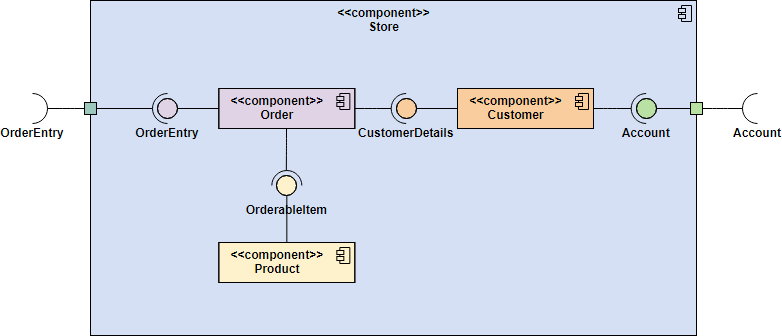
Component Diagram Example – White-Box View of a Component
In the previous examples, those component diagrams are called black-box views. Ports are shown as squares bordering the component, these indicate how the interfaces of the component are used internally. Objects implementing a required interface are received via a port and objects implementing a provided interface are shared via a port.
In this example, the internal composition of components can also be modeled using component diagrams, this is called a white-box view of the diagram because we can see inside.
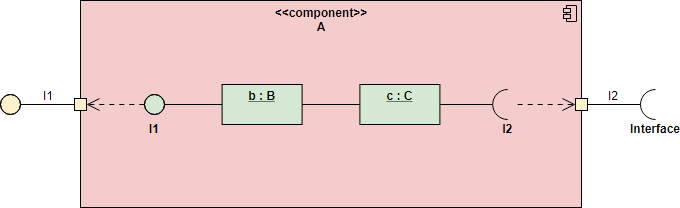
-
Ports are shown as squares bordering the component, these indicate how the interfaces of the component are used internally.
-
Objects implementing a required interface are received via a port and objects implementing a provided interface are shared via a port.
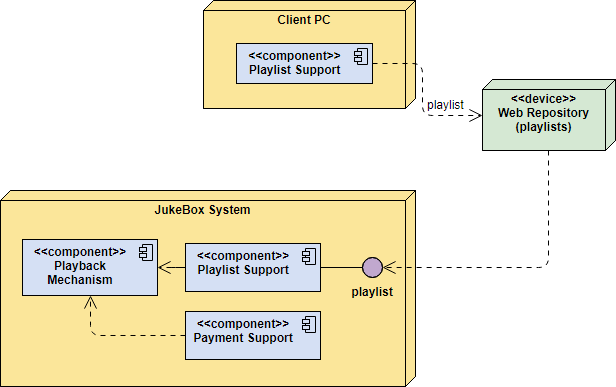
Component Diagram Example – Components in Deployment Diagram
Models the physical deployment of software components with UML deployment diagram. In deployment diagram, hardware components (e.g. web server, mail server, application server) are presented as nodes, with the software components that run inside the hardware components presented as artifacts.
My Visual Paradigm Experience: Creating Both Diagram Types
Deployment vs Component Diagram
Deployment Diagram
Beginner’s Guide to Deployment Diagrams with Visual Paradigm …
Component Diagram Tutorial
Visual Paradigm provides a comprehensive environment for building both deployment and component diagrams, whether you are using the desktop application or the online version. These diagrams are essential for modeling the physical architecture and modular organization of a system.
Creating Deployment Diagrams: My Step-by-Step Process
Deployment diagrams visualize how software artifacts are mapped to physical hardware nodes, showing the system’s runtime configuration.
-
Start a New Diagram: In the toolbar, go to Diagram > New. Search for and select Deployment Diagram.
-
Add Nodes: Use the palette on the left to select Node (the 3D cube shape representing hardware or execution environments) and click on the canvas.
-
Place Artifacts/Components: Drag Artifacts (files like .jar or .exe) or Components directly onto the nodes to indicate they reside there.
-
Connect with Associations: Use the Resource Catalog (the icon that appears when you click a node) to drag and drop connection lines to other nodes, defining communication paths.
-
Refine Details: You can add Stereotypes (e.g., <>) or Notes to specify protocols like HTTPS or TCP.
Creating Component Diagrams: My Modular Design Workflow
Component diagrams focus on the internal structure of the software, showing how modular parts interact through interfaces.
-
Initialize the Diagram: Select Diagram > New and choose Component Diagram.
-
Define Components: Add Component shapes to the canvas. You can group them within other components for nested systems.
-
Establish Interfaces:
-
Provided Interfaces: Use the Resource Catalog from a component to drag out a Realization -> Interface (represented by a “lollipop” icon).
-
Required Interfaces: Connect components to interfaces they depend on using a Dependency -> Interface (represented by a “socket” icon).
-
-
Manage Visibility: Right-click components to show or hide specific attributes or operations through the “Presentation Options” menu.
Key Features and Shortcuts That Saved Me Time
-
Resource Catalog: This “all-in-one” button appears next to selected shapes; dragging it allows you to create and connect a new element in a single motion.
-
AI Tools: You can use the AI Chatbot to brainstorm architectures or generate initial diagrams from text descriptions.
-
Templates: Both Visual Paradigm Online and the desktop version offer pre-built templates for common systems like web applications or client-server models.
-
Free Edition: The Community Edition (desktop) and VP Online Free Edition support both diagram types for non-commercial use.
If you’d like, I can:
-
Help you choose between the desktop and online versions based on your project needs.
-
Explain how to export your diagrams to Word or PDF for documentation.
-
Provide a specific example walkthrough for a common architecture like a cloud-hosted web app.
Conclusion: Why These Diagrams Transformed My Development Process
After months of using Visual Paradigm to create deployment and component diagrams, I can confidently say these tools have fundamentally changed how I approach system design. What started as a theoretical exercise in UML modeling became a practical lifeline for preventing costly deployment errors and improving team communication.
The biggest takeaway? Deployment diagrams force you to think about infrastructure early, while component diagrams help you build modular, maintainable software. Together, they create a powerful feedback loop: your component design informs your deployment strategy, and your deployment constraints shape your component architecture.
If you’re still sketching system topologies on whiteboards or documenting deployments in scattered Word files, I encourage you to try Visual Paradigm’s free online tools. Start small—model just one subsystem or deployment scenario—and watch how quickly these diagrams become indispensable to your workflow. The time invested in learning these notations pays exponential dividends in reduced deployment surprises, clearer team alignment, and more resilient system architectures.
Remember: great software isn’t just well-written code—it’s code that runs reliably where it needs to, when it needs to. Deployment and component diagrams are your roadmap to making that happen.
References
- Component Diagram User Guide: Official Visual Paradigm documentation covering component diagram creation, notation reference, and best practices for modeling modular software architecture.
- Visual Paradigm Interface Guide: Comprehensive user guide explaining Visual Paradigm’s interface, tool palettes, and diagram editing workflows for efficient modeling.
- Exploring Visual Paradigm Online: A Comprehensive Guide: In-depth blog post reviewing Visual Paradigm Online’s features, use cases, and practical tips for system modeling with various UML diagrams.
- Deployment Diagram Tutorial Video: Step-by-step video tutorial demonstrating how to create professional deployment diagrams using Visual Paradigm’s tools and templates.
- What is a Deployment Diagram?: Foundational guide explaining deployment diagram concepts, notation, and when to use them in system architecture design.
- Drawing Deployment Diagrams Guide: Detailed technical documentation on creating deployment diagrams, including node configuration, artifact placement, and connection modeling.
- How to Draw Deployment Diagrams in UML: Practical tutorial with screenshots and examples for building deployment diagrams from scratch using Visual Paradigm.
- Beginner’s Guide to Deployment Diagrams: Accessible introduction for newcomers covering deployment diagram fundamentals, common patterns, and Visual Paradigm Online workflows.
- Component Diagram Concepts Video: Video walkthrough of component diagram notation, interface modeling, and practical examples for modular system design.
- What is a Component Diagram?: Authoritative guide to component diagram theory, notation standards, and application in object-oriented system modeling.
- Drawing Component Diagrams Guide: Technical reference for creating component diagrams, including interface modeling, port configuration, and component assembly techniques.
- Component Diagram Tutorial: Interactive online tutorial with hands-on exercises for mastering component diagram creation in Visual Paradigm Online.
- Visual Paradigm Official Website: Main portal for Visual Paradigm products, resources, tutorials, and community support for UML modeling and system design tools.
- Deployment Diagram Templates: Library of pre-built deployment diagram templates for common architectures including web apps, client-server systems, and cloud deployments.
- Free Deployment Diagram Tool: Information about Visual Paradigm’s free tier for creating deployment diagrams, including feature limitations and upgrade options.
- Deployment Diagram Software Features: Overview of advanced features for deployment diagram modeling, including collaboration tools, export options, and integration capabilities.