As a Product Manager with over seven years of experience bridging the gap between technical engineering and business strategy, I have seen my fair share of diagramming tools. Whether it’s whiteboarding in a conference room or wrestling with complex enterprise architecture models, the right tool can make or break a project’s momentum.
Recently, I took a deep dive into the Visual Paradigm ecosystem. What struck me wasn’t just its ability to draw boxes and arrows, but its holistic approach to solving “documentation debt”—that persistent headache where your documentation never quite matches your actual system design. This guide shares my experience navigating their three distinct interfaces and how their unique Pipeline integration changed the way our team handles technical documentation.
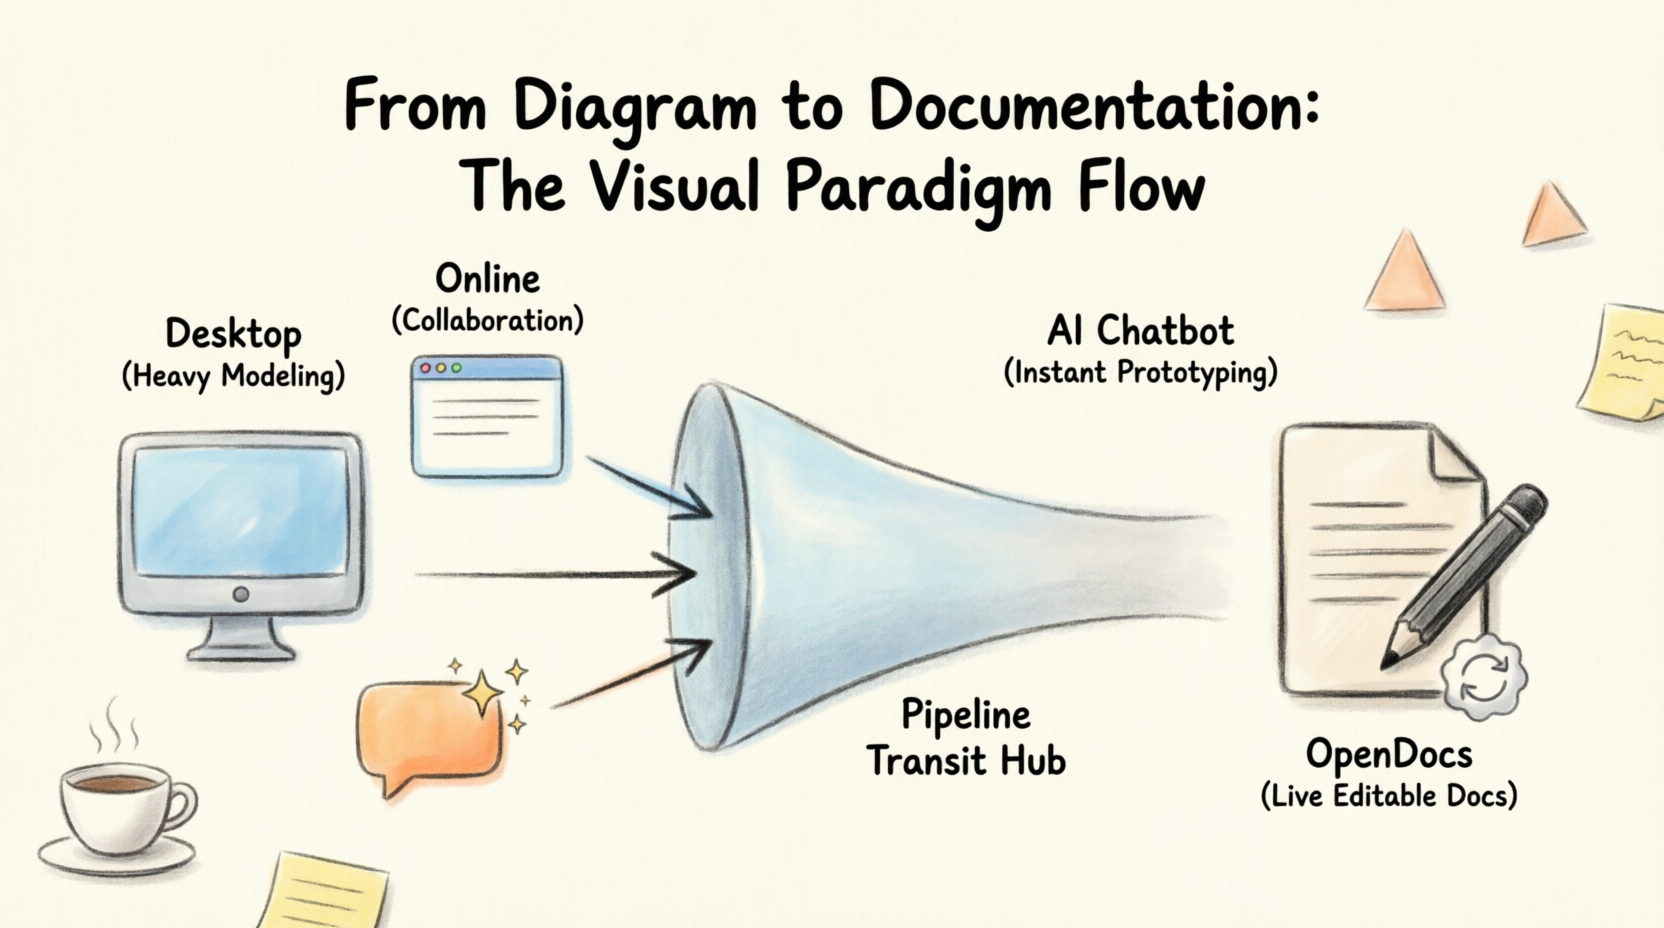
The Three Faces of Visual Paradigm
One of the first things you notice is that Visual Paradigm isn’t a one-size-fits-all application. It splits its diagramming capabilities into three distinct interfaces, each tailored for a specific workflow and user persona.
1. The Desktop Experience: Heavy-Duty Modeling
The Desktop application is the powerhouse of the suite. It’s a dedicated native app for Windows, Mac, and Linux that leverages heavy-duty system modeling engines.
-
The Workflow: You work in a robust design environment where you manually drag-and-drop structural blocks. It’s built for mapping complex dependencies and managing large-scale enterprise project repositories.
-
Best For: System architects and enterprise modelers who need strict engineering validation, large models, and code generation capabilities. If you are mapping out enterprise-grade systems architecture, doing complex database modeling (ERDs), or working inside heavy regulatory frameworks, this is your home base.
2. The Online Experience: Speed and Collaboration
The Online interface brings diagramming directly into your standard web browser. The workflow here prioritizes speed, flexible web-stencils, and fast, multi-user real-time canvas collaboration.
-
The Workflow: You create and edit diagrams without any software installations. It’s lightweight and designed for quick interactions.
-
Best For: Distributed agile teams and rapid wireframing. Use this when you need to co-edit a flowchart with your team during an active meeting, or build quick visual assets on the fly.
3. The AI Chatbot Experience: Instant Prototyping
Perhaps the most intriguing addition is the AI Chatbot interface. Here, you use natural language prompts inside an interactive text box. The AI instantly parses your specifications and auto-generates structurally correct, industry-compliant UML or flow charts onto your canvas.
-
The Workflow: You type out your requirements, and the AI handles the drawing. It uses text-to-diagram rules logic engines to interpret your intent.
-
Best For: Developers and analysts exploring initial concepts. Use this when you have a block of written business text, user stories, or functional requirements, and you want an instantaneous visual map without manual drawing friction.
Platform Comparison at a Glance
To help you decide which interface fits your current task, here is a breakdown of their core differences:
| Feature | Desktop | Online | AI Chatbot |
|---|---|---|---|
| Primary Interface | Local Native App (Windows/Mac/Linux) | Web Browser | Text Conversational Box |
| Strengths | Strict engineering, large models, code generation | Fast collaboration, drag-and-drop, cloud access | Instant prototyping from textual requirements |
| Automation | Deep modeling rule validation (OMG/IEEE) | Layout templates and structural shapes | Text-to-diagram rules logic engines |
| Best For | System architects and enterprise modelers | Distributed agile teams and rapid wireframing | Developers and analysts exploring initial concepts |
Solving Documentation Debt: The Pipeline ➔ OpenDocs Flow
For years, my team struggled with what I call “documentation debt.” We would spend hours perfecting a system diagram in our modeling tool, only to export it as a static PNG, upload it to Confluence or Google Docs, and then forget about it. Two weeks later, the code changes, but the diagram remains outdated.
Visual Paradigm addresses this with the Pipeline ➔ OpenDocs integration. This workflow transforms diagrams from static images into live, editable assets within your documentation platform.
How It Works
Why It Matters
-
Eliminates Manual Friction: Traditionally, you had to export diagrams as static PNG images, manually upload them into your text documents, and re-do the whole cycle for every tiny edit. The Pipeline replaces this with a direct Asset Transit Hub.
-
Preserves Live Editability: Diagrams sent through the Pipeline are not flattened images. They remain vector-quality graphics linked directly to their source files. This means you can click a pencil icon in OpenDocs to instantly modify the original model layout without leaving your document.
-
Automated Version & Revision Control: The Pipeline manages version tracking. When a system engineer commits or pushes updates to a diagram from the desktop client, the Pipeline pushes a tracked revision to the cloud. Document owners can review all historical edits and swap the documentation’s display to the latest version with one click.
Text-to-Diagram: Treating Diagrams as Code
Another feature that resonated with my technical background is Visual Paradigm’s support for code-first modeling using text formats like PlantUML. The core philosophy here is treating diagrams as code so they can be versioned, edited, and automatically rendered.
Here are three common examples of how this works:
1. Use Case Diagram
Use case diagrams define system boundaries, system actors (users/external forces), and the target goals (use cases) they interact with.
PlantUML Example:
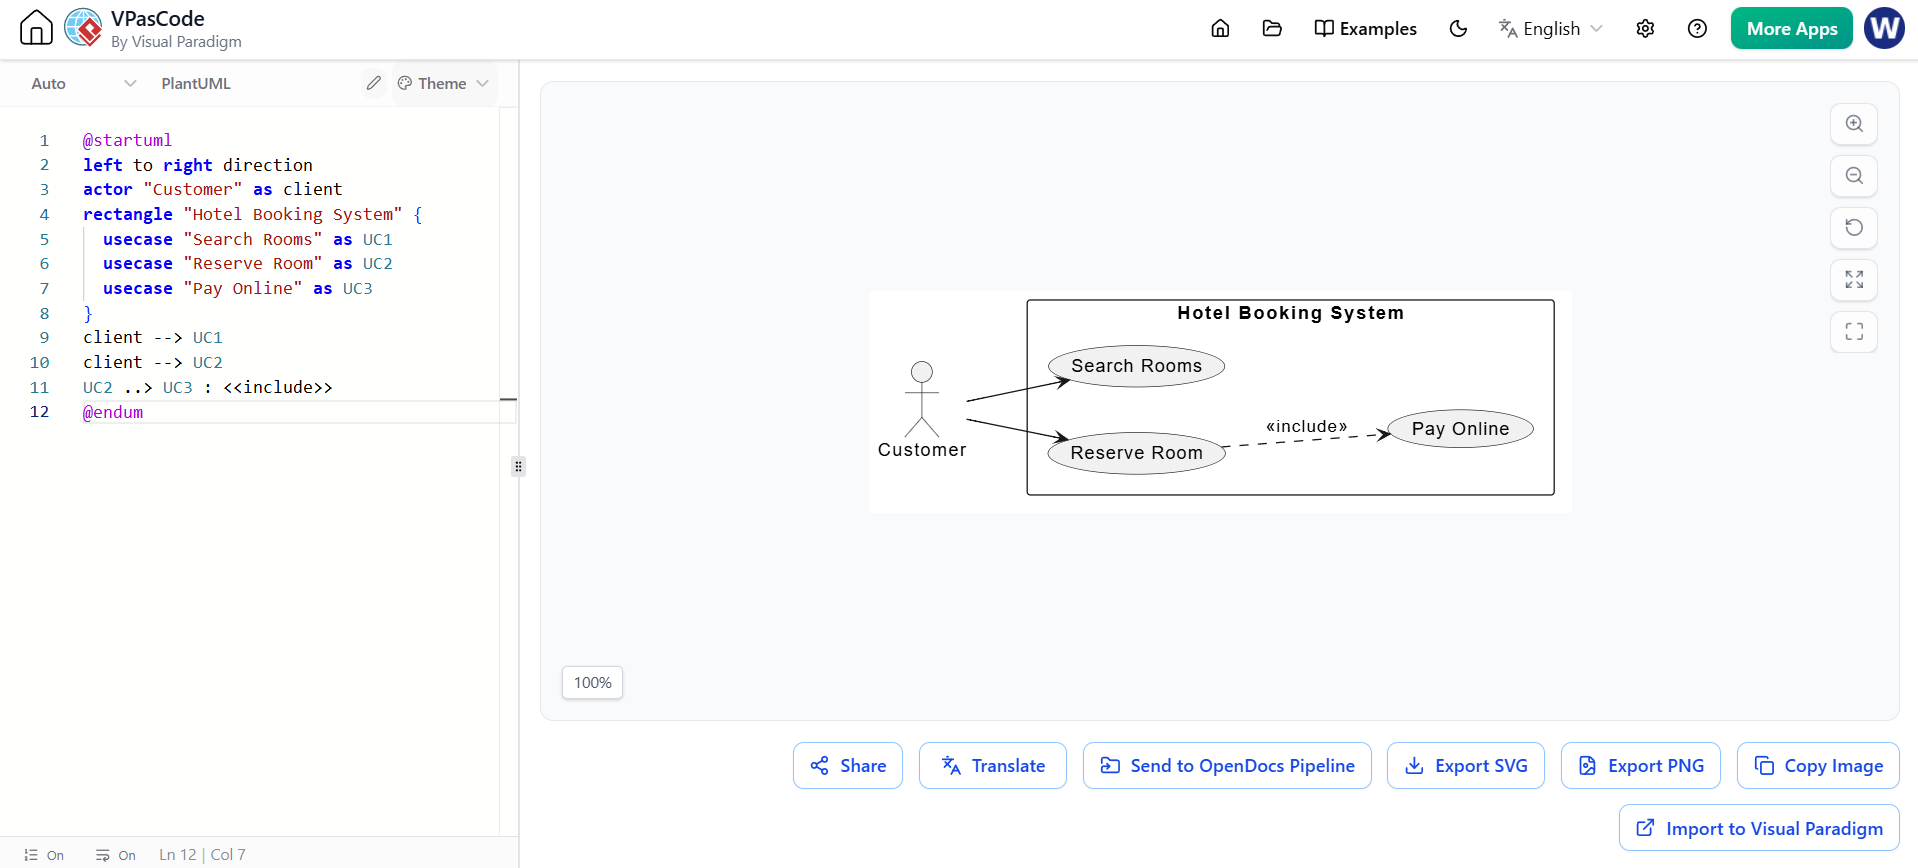
@startuml
left to right direction
actor "Customer" as client
rectangle "Hotel Booking System" {
  usecase "Search Rooms" as UC1
  usecase "Reserve Room" as UC2
  usecase "Pay Online" as UC3
}
client --> UC1
client --> UC2
UC2 ..> UC3 : <<include>>
@endum
2. Sequence Diagram
Sequence diagrams highlight the exact timeline and ordered exchange of text messages or data payloads between running system objects or actors.
PlantUML Example:
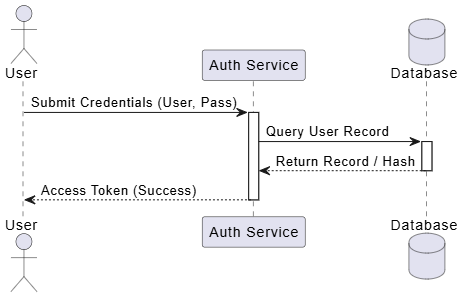
@startuml
actor User
participant "Auth Service" as Auth
database Database

User -> Auth : Submit Credentials (User, Pass)
activate Auth
Auth -> Database : Query User Record
activate Database
Database --> Auth : Return Record / Hash
deactivate Database
Auth --> User : Access Token (Success)
deactivate Auth
@endum
3. Class Diagram
Class diagrams form the blueprint of object-oriented code, explicitly laying out system classes, operations, attributes, and explicit structural relationships like encapsulation or inheritance.
PlantUML Example:
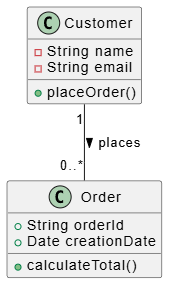
@startuml
class Order {
  + String orderId
  + Date creationDate
  + calculateTotal()
}
class Customer {
  - String name
  - String email
  + placeOrder()
}
Customer "1" -- "0..*" Order : places >
@endum
Final Thoughts
My experience with Visual Paradigm has been refreshing. In a market saturated with simple drawing tools, Visual Paradigm stands out by offering a tiered approach that respects the different needs of architects, agile teams, and developers.
The Desktop app provides the rigor needed for serious enterprise modeling. The Online tool offers the flexibility modern remote teams crave. And the AI Chatbot lowers the barrier to entry for those who think in words rather than shapes. But the real game-changer is the Pipeline. By linking diagrams directly to documentation, it solves the age-old problem of stale docs, ensuring that your knowledge base remains a living, breathing reflection of your product.
For any Product Manager or Technical Lead looking to streamline their workflow and reduce the friction between design and documentation, Visual Paradigm’s ecosystem is worth a serious look.
References
- From Diagram to Documentation: A Beginner’s Guide to the Visual Paradigm Pipeline: An introductory guide explaining how the Pipeline connects diagramming tools to documentation platforms.
- From Concept to Knowledge Base: How the Visual Paradigm Pipeline Eliminates Documentation Debt: Discusses the strategies for keeping documentation up-to-date using automated pipelines.
- From Silos to Synergy: How Visual Paradigm OpenDocs Transforms Team Documentation Through AI-Powered Visual Collaboration: Explores the collaborative features of OpenDocs and AI integration.
- What Makes Visual Paradigm’s AI Chatbot Different From Other AI Diagram Tools?: A comparative analysis of Visual Paradigm’s AI capabilities against competitors.
- A Beginner’s Guide to AI-Powered UML with Visual Paradigm: Tutorial on using AI to generate UML diagrams from text.
- Visual Paradigm OpenDocs Features: Overview of the features and capabilities of the OpenDocs platform.
- Mastering the Pipeline in Visual Paradigm OpenDocs: A Complete Guide to Streamlined Knowledge Management: Comprehensive guide on utilizing the Pipeline for knowledge management.
- From Text to Architecture: A Beginner’s Guide to AI-Powered UML with Visual Paradigm: Guide on converting textual requirements into architectural diagrams.
- Visual Paradigm OpenDocs: The Complete Guide to AI-Powered Knowledge Management and Diagram Generation: Detailed review of OpenDocs and its AI features.
- From Concept to Knowledge Base: How the Visual Paradigm Pipeline Eliminates Documentation Debt: Revisited resource on eliminating documentation debt.
- From Diagrams to Documentation: A Hands-On Review of Visual Paradigm’s Pipeline and OpenDocs Share History: Practical review of the sharing and history features.
- From Code to Clarity: A Beginner’s Guide to Seamless Diagramming with VPAsCode and OpenDocs: Guide on integrating code-based diagramming with documentation.
- From Model to Manual: A Software Engineer’s Guide to Syncing Visual Paradigm Desktop Diagrams with OpenDocs: Technical guide for engineers on syncing desktop models.
- Sync AI Diagram to OpenDocs Pipeline Guide: Release notes and guide for syncing AI-generated diagrams.
- Mastering UML in 2025: The 7 Diagrams Every Developer Must Know: Overview of essential UML diagrams for developers.
- Sequence Diagrams vs Other UML Diagrams: When to Use Which?: Comparative guide on choosing the right UML diagram.
- Mastering Visual Paradigm OpenDocs: The Ultimate Guide to AI-Powered Knowledge Management and the Pipeline Ecosystem: In-depth guide to the entire OpenDocs ecosystem.
- How to Document Working Procedures for BPMN Tasks: Tutorial on documenting business processes.
- Class Diagram User Guide: Official user guide for creating class diagrams.
- Visual Paradigm Tutorial Video: Video tutorial demonstrating Visual Paradigm features.
- Visual Paradigm OpenDocs: The Complete Developer’s Guide to AI-Powered Technical Documentation: Developer-focused guide to technical documentation with AI.