As a Product Manager who has spent years bridging the gap between technical engineering teams and business stakeholders, I’ve always struggled with one persistent pain point: documentation drift. We build beautiful architecture diagrams in specialized tools, but by the time they reach the Confluence page or the developer wiki, they are often outdated screenshots that no longer reflect the current system state.
Recently, I had the opportunity to dive deep into Visual Paradigm’s (VP) modern engineering workflow, specifically their integration of VPasCode and OpenDocs. This isn’t just another diagramming tool; it’s an attempt to solve the “living documentation” problem by treating diagrams as code. Here is my comprehensive review and guide on how this ecosystem transforms the way we handle architectural knowledge management.
The Core Philosophy: Diagram-as-Code (DaC)
The traditional approach to diagramming involves dragging and dropping shapes—a manual, pixel-pushing process that is hard to version control and even harder to automate. Visual Paradigm shifts this paradigm with Diagram-as-Code (DaC).
In this model, design moves from manual manipulation to declarative code blocks. Updates are managed via plain text scripts (like PlantUML or Mermaid). This means your architecture diagrams live in your repository alongside your application code, subject to the same rigorous version control and review processes.
🧱 The Architectural Pipeline Blueprint
What impressed me most about the VP ecosystem is its linear, three-tier data lifecycle. It creates a seamless bridge from ideation to final documentation consumption.
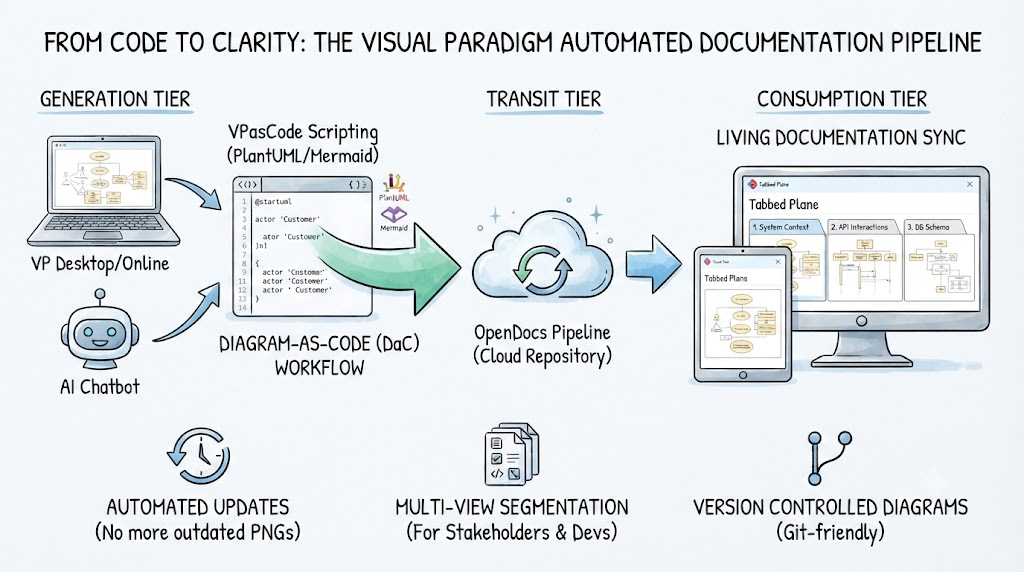
1. Generation Tier (Diagramming)
This is where the visual assets originate. You have flexibility here depending on your team’s preference:
-
VP Desktop: For enterprise-grade, heavy-duty modeling.
-
VP Online: A collaborative SaaS platform for real-time teamwork.
-
AI Chatbot: For rapid prototyping using natural language text-to-diagram prompts.
2. The Pipeline (Transit Tier)
This acts as the secure, cloud-hosted version control bridge. When you click “Send to OpenDocs Pipeline” inside your modeling canvas or VPasCode environment, the underlying script and its rendered SVG asset are securely pushed to your organization’s OpenDocs Workspace. This step ensures that the “source of truth” is always centralized and accessible.
3. Consumption Tier (OpenDocs Hub)
This is where technical writers and developers consume the artifacts. Instead of embedding static images, you load artifacts directly from the pipeline. A standout feature here is the Tabbed Plane layout, which allows you to toggle cleanly between various microservices, environments, or design levels on a single documentation screen.
💡 Key Concepts That Changed My Workflow
VPasCode: The Unified Sandbox
VPasCode is a browser-native multi-engine sandbox. It supports native rendering for PlantUML, Mermaid, and Graphviz. This flexibility is crucial because different teams prefer different syntaxes. Having them all in one place reduces tool fragmentation.
Living Documentation
The concept of “Living Documentation” is the killer feature here. If a backend flow alters, you simply edit the text-to-diagram script in VPasCode. This auto-pushes a new revision down the Pipeline. Connected OpenDocs components immediately alert authors to swap to the latest variant. No more hunting for the latest .png file in Slack.
Tabbed Plane Segmentation
This layout pattern in OpenDocs allows different architectural abstractions to reside within individual tabbed panes on the exact same documentation screen. For example, you can have:
-
Tab 1: High-level System Context (for stakeholders)
-
Tab 2: Detailed API Interactions (for developers)
-
Tab 3: Database Schema (for DBAs)
All on one page, all synced from the same source.
🛠️ Practical Implementation: PlantUML Examples
To test the system, I configured two production-ready examples using the VPasCode ecosystem. These demonstrate how to structure diagrams for different audiences within the Tabbed Plane layout.
Example 1: Use Case Diagram (System Boundary Approach)
Best suited for Tab 1 (“System Context”) to align non-technical stakeholders.
This diagram defines the boundary of the e-commerce checkout system, showing actors and high-level use cases without getting bogged down in technical implementation details.
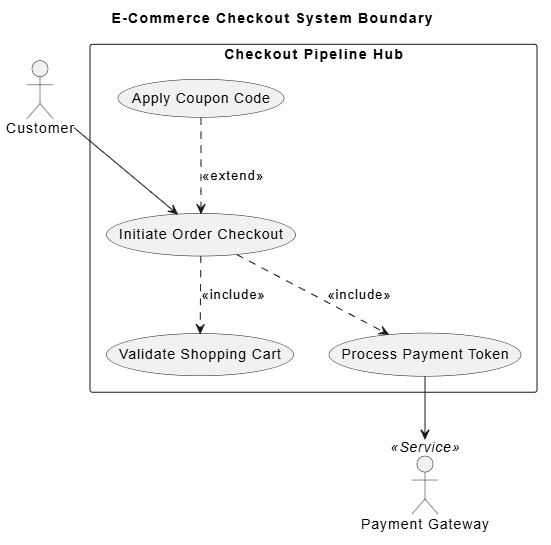
@startuml
skinparam backgroundColor #FFFFFF
skinparam handwritten false
skinparam packageStyle rectangle

title E-Commerce Checkout System Boundary

actor "Customer" as client
actor "Payment Gateway" as stripe << Service >>

rectangle "Checkout Pipeline Hub" {
    usecase "Initiate Order Checkout" as UC_Checkout
    usecase "Validate Shopping Cart" as UC_Validate
    usecase "Process Payment Token" as UC_Payment
    usecase "Apply Coupon Code" as UC_Coupon

    client --> UC_Checkout
    UC_Checkout ..> UC_Validate : <<include>>
    UC_Checkout ..> UC_Payment : <<include>>
    UC_Coupon ..> UC_Checkout : <<extend>>

    UC_Payment --> stripe
}
@enduml
Example 2: Sequence Diagram (API Interaction Flow)
Best suited for Tab 2 (“Detailed Interaction Flow”) to map technical component execution.
This diagram dives into the technical specifics of user authentication, showing the exact message flow between the client, auth service, and database.
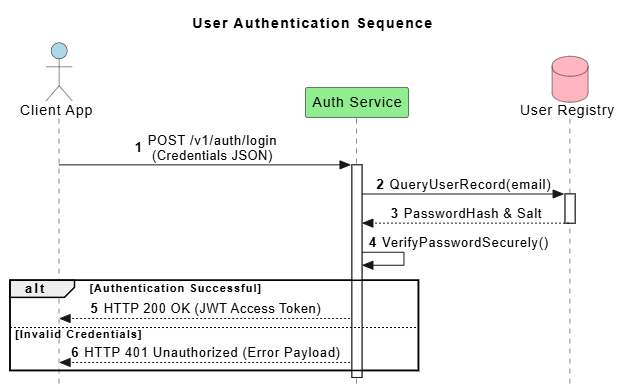
@startuml
autonumber
skinparam style strictuml
skinparam sequenceMessageAlign center

title User Authentication Sequence

actor "Client App" as UI #LightBlue
participant "Auth Service" as API #LightGreen
database "User Registry" as DB #LightPink

UI -> API: POST /v1/auth/login\n(Credentials JSON)
activate API

API -> DB: QueryUserRecord(email)
activate DB
DB --> API: PasswordHash & Salt
deactivate DB

API -> API: VerifyPasswordSecurely()

alt Authentication Successful
    API --> UI: HTTP 200 OK (JWT Access Token)
else Invalid Credentials
    API --> UI: HTTP 401 Unauthorized (Error Payload)
end
deactivate API

@enduml
🔄 The OpenDocs Pipeline Sync Process
Once your PlantUML or Mermaid scripts are ready, the synchronization process is straightforward and designed for minimal friction:
-
Push from VPasCode: Click the “Send to OpenDocs Pipeline” button on the viewer dashboard. This commits your script and generated SVG to the cloud repository.
-
Access OpenDocs: Open your target OpenDocs knowledge layout where the documentation lives.
-
Embed Layout Components: Create your Tabbed Plane layout component container. This sets up the structure for your multi-view documentation.
-
Pull Assets:
-
In Tab 1, select
Insert > Pipelineand drop the Use Case Artifact. -
In Tab 2, link the Sequence Interaction Flow directly from the asset roster.
-
This pull-based mechanism ensures that your documentation always references the latest approved version from the pipeline, maintaining integrity across your knowledge base.
Conclusion
Visual Paradigm’s integration of VPasCode and OpenDocs represents a significant leap forward in technical documentation. By treating diagrams as code and automating the transit from design to documentation, it solves the perennial problem of outdated architectural diagrams.
For Product Managers and Engineering Leads, this workflow offers clarity and consistency. For Developers, it reduces the overhead of maintaining separate diagram files. The ability to segment complex information into Tabbed Planes while keeping the source synchronized via the Pipeline makes this a robust solution for modern engineering teams aiming for true “Living Documentation.”
If you are still manually exporting PNGs and uploading them to wikis, it might be time to consider shifting to a Diagram-as-Code workflow. The initial learning curve of PlantUML or Mermaid is small compared to the long-term gains in accuracy and maintainability.
References
-
From Code to Clarity: A Beginner’s Guide to Seamless Diagramming with VPasCode and OpenDocs: An introductory guide explaining the integration between VPasCode scripting and OpenDocs for automated documentation.
-
From Diagram to Documentation: A Beginner’s Guide to the Visual Paradigm Pipeline: A comprehensive overview of the three-tier architectural pipeline from generation to consumption.
-
From Code to Clarity: A Beginner’s Guide to Seamless Diagramming with VPasCode and OpenDocs: Detailed insights into the seamless connection between code-based diagramming and documentation platforms.
-
Seamlessly Connect Diagramming to Documentation: VPasCode Integrates with OpenDocs: Release notes and features detailing the integration capabilities between VPasCode and the OpenDocs pipeline.
-
C4-PlantUML Studio: Features and capabilities of Visual Paradigm’s support for C4 model visualization using PlantUML.
-
Seamlessly Connect Diagramming to Documentation: VPasCode Integrates with OpenDocs: Technical details on how diagram assets are pushed and pulled through the OpenDocs pipeline.
-
Comprehensive Guide to VPasCode by Visual Paradigm: A deep dive into the VPasCode tool, covering its engines, syntax support, and best practices.
-
VPasCode Features: Overview of VPasCode capabilities, including multi-engine support for PlantUML, Mermaid, and Graphviz.
-
Introducing VPasCode: The Ultimate Unified Text-to-Diagram Platform: Announcement and feature breakdown of the VPasCode platform launch.
-
Visual Paradigm Pipeline Demo: Video demonstration of the pipeline sync process and OpenDocs integration.
-
Mastering VPasCode: The Ultimate Guide to AI-Powered Diagram-as-Code with Multi-Engine Support: Advanced guide on leveraging AI and multiple diagramming engines within VPasCode.