

UML component diagrams and deployment diagrams are both structural diagrams in the Unified Modeling Language (UML), but they serve distinct purposes in software architecture modeling.
-
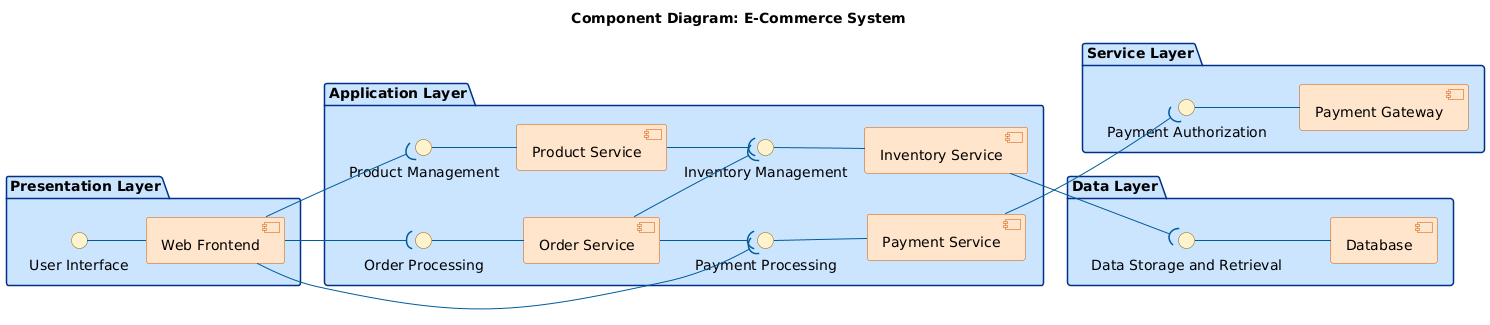
Component Diagram — Focuses on the logical/modular structure of the software system. It shows reusable software components (e.g., modules, libraries, services), their interfaces, ports, and dependencies/relationships. This diagram emphasizes what the system is built from at a high level of abstraction, highlighting modularity, encapsulation, and how components interact without detailing physical hardware.
Key elements include:
-
Components (rectangles with <> stereotype)
-
Interfaces (provided/required)
-
Ports
-
Connectors/dependencies
-
Artifacts (sometimes)
Example from your e-commerce system: The component diagram illustrates this well — it models services like Product Service, Inventory Service, Order Service, and Payment Service as logical components, connected via interfaces (e.g., Product Management, Inventory Management, Order Processing, Payment Processing). It shows dependencies between them and links to the frontend and database, representing the modular software architecture.
-
-
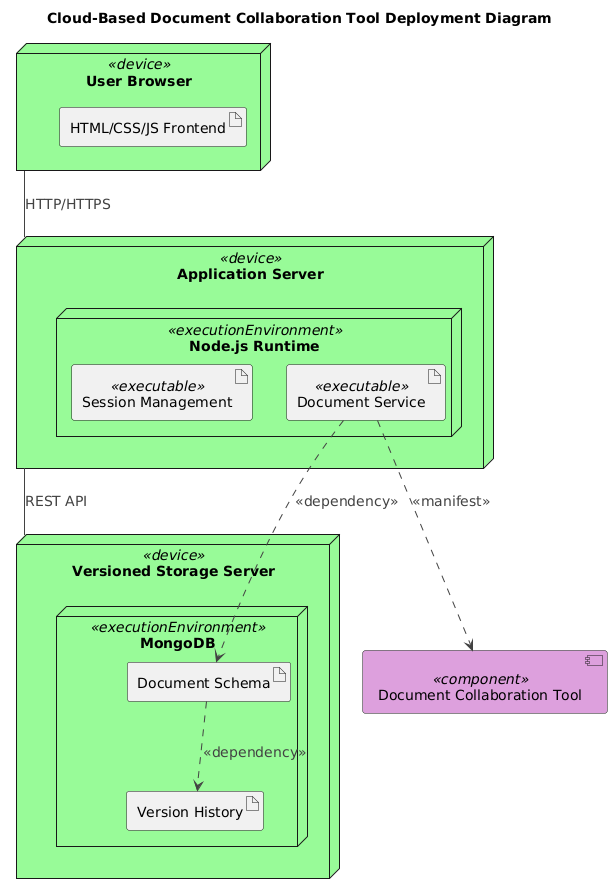
Deployment Diagram — Focuses on the physical/runtime architecture. It models how software components (or artifacts) are deployed onto hardware or execution environments (nodes), including devices, servers, and communication paths. This diagram addresses where and how the system runs in the real world, often for infrastructure planning, scalability, and performance considerations.
Key elements include:
-
Nodes (e.g., servers, devices, <> or <>)
-
Artifacts (deployed files/components)
-
Communication paths/associations
-
Deployment specifications
Example from your provided diagrams: The second diagram (Cloud-Based Document Collaboration Tool Deployment Diagram) shows physical aspects — user browsers connecting via HTTP/HTTPS to an Application Server (with Node.js runtime executing Session Management and Document Service), which depends on a Versioned Storage Server running MongoDB for document schema and version history. It highlights runtime nodes, executables, and dependencies in a deployed environment.
-

Key Differences Summary (based on standard UML and Visual Paradigm resources):
| Aspect | Component Diagram | Deployment Diagram |
|---|---|---|
| Primary Focus | Logical software structure & modularity | Physical hardware/runtime deployment |
| Level of Abstraction | High-level design (software components) | Low-level implementation (nodes & artifacts) |
| Key Question | How is the software organized modularly? | Where and how is the software physically deployed? |
| Typical Use | Component-based design, interfaces/dependencies | Infrastructure topology, cloud/on-prem setup |
| Main Elements | Components, interfaces, ports, connectors | Nodes, artifacts, communication paths |
| Relationship | Components from component diagrams are often deployed as artifacts in deployment diagrams | Deployment shows runtime instances of logical components |
These diagrams complement each other: a component diagram defines the “what” (software building blocks), while a deployment diagram shows the “where/how” (physical realization).
How Visual Paradigm’s AI Support Can Help with These Diagrams
Visual Paradigm integrates powerful AI features (primarily through its AI Chatbot at chat.visual-paradigm.com and the AI Diagram Generator) to accelerate creation, refinement, and understanding of both diagram types. These tools use natural language prompts to generate accurate, UML-compliant diagrams instantly, reducing manual effort and errors.

-
For Component Diagrams:
-
The AI excels at generating UML component diagrams (including C4 component views) from text descriptions.
-
You can prompt: “Generate a UML component diagram for an e-commerce system with Product Service, Order Service, Inventory Service, Payment Service, and their dependencies.”
-
It automatically applies correct notation (components, ports, interfaces, connectors), suggests layouts, and allows conversational refinement (e.g., “Add a dependency from Order Service to Payment Service” or “Make it more modular”).
-
Recent upgrades focus on better layout quality, stability, accuracy, and iterative editing — ideal for complex modular architectures.
-
-
For Deployment Diagrams:
-
The AI supports direct generation of UML deployment diagrams (and C4 deployment views) via prompts like: “Create a deployment diagram for a cloud-based e-commerce app with web frontend on browser, Node.js application server, MongoDB database, and HTTP connections.”
-
It handles nodes (<>, <>), artifacts, communication paths, and stereotypes effectively.
-
Tutorials show step-by-step creation and updates via chat, making it easy to model real-world infrastructure (e.g., AWS, cloud servers, databases).
-
Supports cross-linking (e.g., connect a generated deployment diagram back to a component diagram for end-to-end views).
-
Overall Benefits of Visual Paradigm AI for Both:
-
Instant text-to-diagram conversion — no blank-canvas frustration.
-
Conversational editing: Refine via follow-up prompts (add/remove elements, change relationships).
-
Standards compliance: Ensures proper UML notation.
-
Integration: Export to projects, link models, or combine with other tools (e.g., PlantUML support).
-
Time savings: Great for prototyping, education, or complex systems like your e-commerce or collaboration examples.
If you provide a specific system description (e.g., refining your e-commerce diagram), I can help simulate prompts or explain further! For hands-on use, check Visual Paradigm’s AI Chatbot directly.
General Guidelines for Both Diagrams in Visual Paradigm
- Start with purpose: Always define why you’re creating the diagram (e.g., high-level architecture overview, detailed modular design, infrastructure planning, or stakeholder communication).
- Keep it simple and focused: Avoid overcrowding — aim for 7–12 major elements per diagram. Use sub-diagrams or hierarchical decomposition for complexity.
- Use consistent naming and stereotypes: Apply meaningful, descriptive names. Use standard stereotypes like <<service>>, <<database>>, <<device>>, <<executionEnvironment>>.
- Leverage layers and formatting: In Visual Paradigm, use Layers (View > Layers) to toggle annotations, stencils, or non-standard elements for clean exports (e.g., hide custom icons for formal UML views).
- Validate and iterate: Use Visual Paradigm’s model validation features. Export to PDF/SVG for reviews and refine based on feedback.
- AI acceleration: Use the AI Chatbot for instant generation — describe in natural language, then refine conversationally (e.g., “Add a dependency”, “Make Payment Service required interface”).
UML Component Diagram: Guidelines, Tips & Tricks
Core Purpose: Model the logical/modular structure of software — reusable components, interfaces, ports, and dependencies (the “what” of the architecture, focusing on modularity and encapsulation).
Key Guidelines
- Focus on modularity and single responsibility — each component should handle one major concern (e.g., Product Service, not a monolithic “E-commerce Engine”).
- Emphasize interface-driven design — always show provided (lollipop) and required (socket) interfaces for loose coupling.
- Use ports for complex interactions when a component exposes multiple interfaces.
- Show dependencies clearly (dashed arrows) rather than associations unless needed.
- Avoid modeling UI/data classes directly — reserve for class diagrams; focus on deployable/reusable units.
Tips & Tricks in Visual Paradigm
- Creation steps:
- Diagram > New > Component Diagram.
- Drag Component from toolbar, double-click to name/stereotype.
- Add Interface (lollipop/socket), connect via Realization (for provided) or Dependency (for required).
- Use Assembly Connector for interface-to-interface wiring.
- Best visual practices:
- Place provided interfaces on the left/top, required on the right/bottom for clean flow.
- Group related components inside packages or composite components.
- Apply stereotypes consistently (e.g., <<subsystem>>, <<service>>).
- Use compartments in components to show internal artifacts if needed.
- AI Chatbot tricks:
- Prompt examples:
- “Generate a UML component diagram for an e-commerce system with Product Service providing IProduct, Order Service requiring IProduct and providing IOrder, Inventory Service, Payment Service, and Web Frontend.”
- “Add a required interface ‘IPaymentGateway’ to Payment Service.”
- “Refine this to show ports on Order Service.”
- Iterate: “Make it more modular by splitting Payment into Authorization and Processing.”
- Great for C4 component views — prompt “Generate C4 Component Diagram…”
- Prompt examples:
Common Pitfalls to Avoid
- Overusing monolithic components.
- Forgetting to label interfaces clearly.
- Mixing too many levels (logical vs. implementation).
UML Deployment Diagram: Guidelines, Tips & Tricks
Core Purpose: Model the physical/runtime architecture — nodes (hardware/devices), execution environments, artifacts (deployed files/components), and communication paths (the “where/how” of deployment).
Key Guidelines
- Identify nodes first: processors (<<executionEnvironment>> like Node.js Runtime), devices (<<device>> like User Browser), servers.
- Deploy artifacts explicitly (e.g., .jar, .exe, Document Schema) onto nodes.
- Show communication paths with protocols (e.g., <<HTTP>>, <<HTTPS>>, <<REST API>>).
- Use stereotypes for cloud specifics (e.g., <<AWS EC2>>, <<MongoDB>>).
- Highlight topology, scalability, and failure points (e.g., redundant nodes).
Tips & Tricks in Visual Paradigm
- Creation steps:
- Diagram > New > Deployment Diagram.
- Drag Node (or <<device>>/<<executionEnvironment>>), nest if needed.
- Add Artifact, drag onto node to deploy.
- Connect nodes with Communication Path (solid line), stereotype protocols.
- Best visual practices:
- Use 3D node shapes for visual distinction (processors vs. devices).
- Show manifestation (artifact → component) when linking logical to physical.
- Add notes for specs (e.g., OS version, capacity).
- For cloud: stereotype nodes like <<Kubernetes Cluster>>, <<RDS>>.
- AI Chatbot tricks:
- Prompt examples:
- “Create a deployment diagram for a cloud-based document collaboration tool: User Browser connects via HTTPS to Application Server with Node.js Runtime running Session Management and Document Service, which depends on MongoDB Versioned Storage Server.”
- “Add high availability: duplicate the MongoDB node as primary and secondary.”
- “Show artifact ‘document-service.jar’ deployed on the Application Server.”
- Refine: “Change connection to <<WebSocket>> for real-time collaboration.”
- Excellent for quick infrastructure prototypes (AWS, on-prem, hybrid).
- Prompt examples:
Common Pitfalls to Avoid
- Confusing nodes with components (nodes host artifacts/components).
- Omitting protocols on paths.
- Ignoring execution environments (e.g., JVM, Node.js).
Quick Comparison: When to Use Which Diagram
| Scenario | Preferred Diagram | Why |
|---|---|---|
| Designing modular services/interfaces | Component Diagram | Focus on logical wiring and contracts |
| Planning cloud/on-prem infrastructure | Deployment Diagram | Shows physical nodes and deployment |
| Showing how services run in production | Both (linked) | Component → Artifact → Node mapping |
| Prototyping quickly with AI | Either via Chatbot | Text description → instant diagram |
Pro Tip for Visual Paradigm AI: Start broad (“Generate component diagram for e-commerce”), then refine iteratively (“Add Inventory check dependency”, “Deploy to AWS nodes”). This hybrid approach (AI + manual tweaks) saves hours while keeping diagrams professional and UML-compliant.
These practices will help you create clear, effective diagrams — whether for your e-commerce system, document collaboration tool, or any architecture. If you share a specific scenario or prompt you’re trying, I can refine these further!
Component vs Deployment diagram Resource
- What is a Deployment Diagram? A Complete Guide to UML Deployment Diagrams: This comprehensive guide explains the purpose, components, and best practices for modeling the physical architecture of software systems using UML deployment diagrams.
- Component Diagram Software – Visual Paradigm Online: A powerful online tool that allows developers to design detailed component diagrams supporting UML standards and real-time team collaboration.
- Step-by-Step Tutorial: Creating Deployment Diagrams with Visual Paradigm: A hands-on tutorial that walks users through building a deployment diagram from scratch, covering nodes, artifacts, and relationships in real-world scenarios.
- UML Component Diagram Tutorial: Designing Software Architecture: This technical video resource provides a guide on creating diagrams to model the modular structure and dependencies of software systems.
- Comprehensive Tutorial on Deployment Diagrams with Visual Paradigm: An in-depth tutorial explaining how to design and implement deployment diagrams, specifically focusing on real-world system deployment scenarios.
- Major Upgrade to AI UML Component Diagram Generation in Visual Paradigm AI Chatbot: This release details significant enhancements to the AI Chatbot, solidifying it as a tool for generating architectural component models through intelligent automation.
- PlantUML Deployment Diagram Builder – Visual Paradigm Integration: A feature that allows users to generate deployment diagrams using PlantUML syntax, with full support for visualization and editing within the platform.
- Generating and Modifying C4 Component Diagrams with Visual Paradigm AI Chatbot: A specialized tutorial demonstrating how to use the AI-powered chatbot to create and iteratively refine C4 component-level diagrams for complex systems.
- Deployment Diagram in the Software Design Handbook: Part of the official Software Design Handbook, this resource provides practical insights into using deployment diagrams for designing scalable and maintainable software systems.
- UML Component Diagram Tutorial and Tool – Visual Paradigm: A guide and interactive tool designed to help users model software