
Mastering Data Association in BPMN: A Visual Paradigm Tutorial
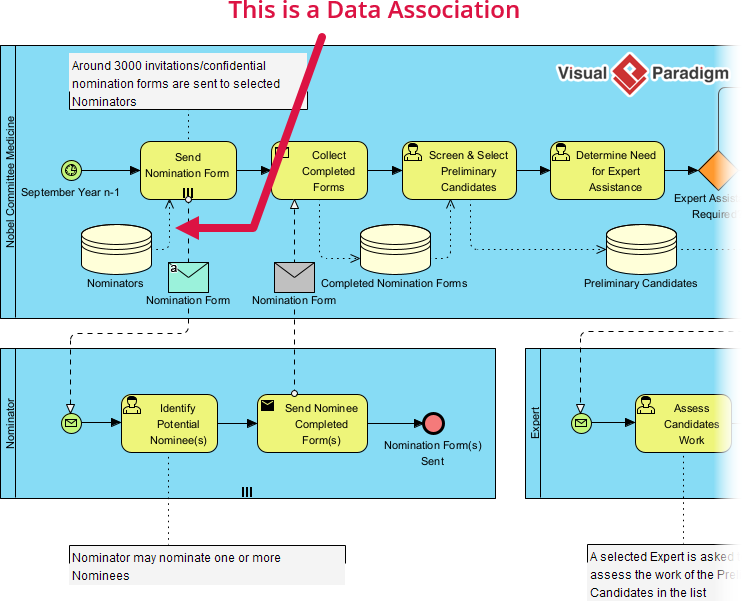
In Business Process Model and Notation (BPMN), understanding the movement of information is just as critical as understanding the movement of the process itself. While the arrows connecting tasks (Sequence Flows) tell us the order of operations, they do not tell us what information is being transformed. This is where Data Association becomes the cornerstone of effective system architecture modeling.
This tutorial will guide you through the mechanics of Data Association, using a real-world “Nobel Committee” scenario to demonstrate how to model the flow of documents, forms, and data objects between actors and activities.
What is Data Association?
Data Association is a specific modeling concept used to represent the input and output of data for an activity. It specifies how data—whether it be documents, database objects, or physical files—is passed into or produced by a task.
Think of a process as a factory assembly line. The Sequence Flow dictates the speed and direction of the line (what happens next). However, the Data Association dictates what parts (data) are required to build the product and what the finished product looks like once it leaves the station.
Why Separation Matters
One of the most common mistakes in process modeling is cluttering the diagram with data flows using standard arrows. Visual Paradigm enforces a clean separation of concerns:
- Sequence Flow (Solid Arrow): Controls the logic and timing (The “When”).
- Data Association (Dashed Arrow): Controls the information requirement (The “What”).
This separation is crucial for maintaining clean, readable diagrams. It allows stakeholders to quickly distinguish between a step that triggers the next step and a step that merely consumes or produces a document.
Visualizing Data Association: The Nobel Committee Scenario
Let’s analyze a specific segment of the Nobel Committee nomination process to see Data Association in action. We will look at the interaction between the Nobel Committee and the Nominators.
Input Data Association
An Input Data Association points from a Data Object to an Activity. This indicates that data is required to perform the task.
In our diagram, consider the activity “Send Nomination Form”. Before the committee can send a form, they must have the list of candidates or the recipient details. This information is often stored in a Data Object (like a database table or a physical file).
Key Visual Cue: In Visual Paradigm, look for the dashed line originating from a data object (e.g., the “Nominators” cylinder) pointing towards the activity. This signifies that the activity is reading from or using that data to function.
Output Data Association
An Output Data Association points from an Activity to a Data Object. This indicates that data is produced or modified by the task.
Look at the activity “Collect Completed Forms”. The result of this activity is a new set of data: the completed forms. This is modeled by a dashed line pointing from the activity to the data object labeled “Completed Nomination Forms.”
Key Visual Cue: A dashed line originating from a task and terminating at a data object represents the creation or updating of that artifact.
Handling Complex Relationships
In the provided diagram, we see a red arrow pointing from the “Send Nomination Form” activity back to the “Nominators” data object. This specific visualization highlights the interaction where a specific set of data (the nomination forms) is being generated and associated with the list of Nominators. The text box noting “Around 3000 invitations…” provides context for the volume of data being handled, which is a vital detail for system architects planning database capacities.
Best Practices for Modeling Data
To ensure your diagrams are professional and easy to read in Visual Paradigm, adhere to the following rules:
- Use Distinct Shapes: Always use the standard BPMN shapes. Data Objects should look like envelopes or sheets of paper. Data Stores should look like cylinders.
- Label Clearly: Never assume a reader knows what a data object contains. Label it explicitly (e.g., “Nomination Form,” “Candidate List”).
- Respect the Dashed Line: Never use a solid line for data flow. If you use a solid line, BPMN interpreters will assume it is a control flow, which changes the logic of your diagram.
- Contextual Text: If the data volume is significant (like the 3000 invitations in our example), use text boxes to annotate the diagram rather than cluttering the flow lines.
Conclusion
Data Association is the bridge between business logic and data architecture. By mastering the distinction between Input and Output associations, you can create diagrams that not only show how a process works but also what information drives it. This level of detail is essential for developers and system architects who need to implement these processes in software.