


Ideal for strategists, educators, marketers, and designers who want to rapidly generate polished, professional infographics—then evolve them seamlessly as ideas grow.
🔍 Why This Guide Is Different
While many tools promise “AI-powered design,” Visual Paradigm’s AI Infographic Generator stands out not just for speed—but for its real-world adaptability during the design evolution phase.
This guide dives deep into how the tool handles expansion of content (e.g., growing from 4 to 6+ items), addresses common pain points like layout collapse and manual rework, and offers a hybrid workflow that blends AI speed with human control—making it ideal for iterative design.
✅ Core Strengths: Speed, Structure, and Smart Layouts
Visual Paradigm’s AI Infographic Generator excels at rapid ideation and initial content structuring. When you input a prompt like:
“Create a 4-step process infographic on project management phases”

The AI automatically:
-
Researches and curates relevant data, statistics, and insights.
-
Structures content into logical sections: titles, descriptions, icons, visual metaphors.
-
Applies a balanced, visually cohesive layout with color schemes, typography, and icons—all in seconds.
💡 Result: A fully formed, presentable infographic in under a minute—perfect for brainstorming or quick client previews.
⚠️ The Reality Check: AI Isn’t Perfect—And That’s Okay
AI-generated output is not a final product. It’s a smart starting point that often requires refinement. Common issues include:
-
Irrelevant or redundant points.
-
Missing critical aspects (e.g., omitting “risk assessment” in a project lifecycle).
-
Overemphasis on minor details.
-
Layouts that feel cramped or unbalanced when expanding.
🔁 Key Insight: You won’t get it right on the first try. But with Visual Paradigm, you don’t need to start over—you can evolve the design with minimal friction.
🔄 The Game-Changer: Handling Expansion Without Manual Rework
One of the biggest challenges in traditional design is adding more items to a 4-item template. In tools like PowerPoint or Figma, this means:
-
Manually resizing boxes.
-
Realigning elements.
-
Adjusting spacing and margins.
-
Fixing visual hierarchy.
In Visual Paradigm, this problem is solved through dynamic, auto-adjusting design architecture—a feature powered by their unified UI and intelligent layout engine.
✅ How It Works: Auto-Adapting for Growth
| Feature | Benefit |
|---|---|
| Flexible item count selection | Choose 4, 5, 6, or even 8 items before generation via the side panel. |
| Real-time preview | See how layout shifts instantly as you increase item count. |
| Auto-resizing & repositioning | Elements dynamically adjust—no manual dragging needed. |
| Preserved visual balance | Even distribution, consistent spacing, and alignment maintained. |
🧩 Example: Start with a 4-step process → later realize you need 6 steps. Simply change the number of items → layout auto-adjusts, preserving style and flow.
This transforms expansion from a chore into a click—making it ideal for evolving ideas during research, stakeholder feedback, or strategy refinement.
🛠️ How to Use It: Step-by-Step Workflow (With Emphasis on Iteration)
Follow this optimized process to generate fast, iterate freely, and finalize with confidence.
🟦 Step 1: Access the Tool
-
Go to: ai.visual-paradigm.com/tool/ai-powered-infographic-generator
-
Log in using your Visual Paradigm account (Combo License recommended for full AI features).
💡 Pro Tip: Use the desktop app for richer functionality and offline access.
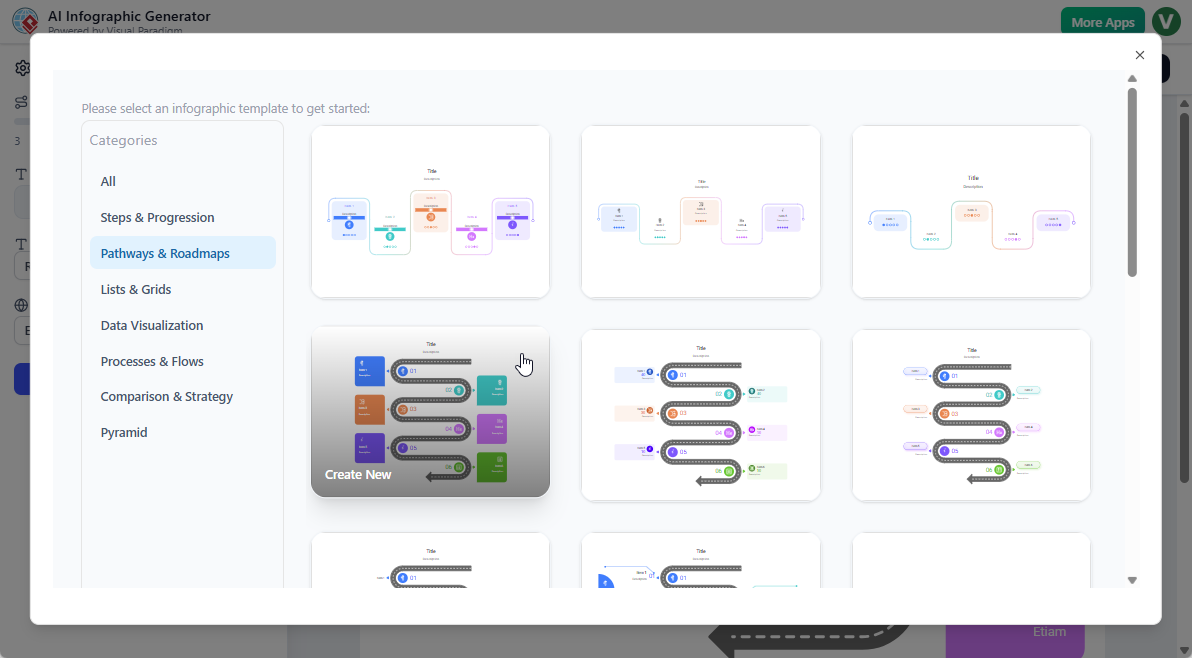
🟨 Step 2: Choose Your Template
Select from a curated gallery of AI-ready templates:
-
Process Infographics (4-step, 5-phase, 7-stage)
-
Comparison Charts
-
Timeline Visuals
-
SWOT, PESTLE, 5 Whys, 4Cs, etc.
-
Custom/Blank Canvas for full control
✅ Many templates are designed for variable item counts, so they adapt naturally when you expand.
🟩 Step 3: Input Prompt & Set Parameters
In the prompt field, be specific:
“List 5 key benefits of remote work, including productivity, cost savings, talent access, work-life balance, and environmental impact.”
In the side panel, configure:
-
Number of items (e.g., 4 → 6 → 8)
-
Font style & size
-
Language (supports multilingual content)
-
Style: Choose from:
-
Professional
-
Hand-Drawn (great for creative or casual tone)
-
Minimalist
-
Bold & Modern
-
🔁 Use real-time preview to test how layout changes with item count—spot potential issues early.
🟪 Step 4: Preview & Tweak Before Generation
Before clicking “Generate,” use:
-
The live preview to see layout changes as you adjust item count.
-
The content outline to verify AI has captured all intended aspects.
✅ Best Practice: Start with a slightly lower item count (e.g., 4) for faster ideation. Expand later.
🟪 Step 5: Generate
Click “Generate” → AI creates:
-
Structured content (titles, bullet points, data)
-
Visuals (icons, charts, illustrations)
-
A fully styled, balanced layout
⏱️ Time: Under 60 seconds for most templates.
🟠 Step 6: Review & Iterate (The Heart of the Workflow)
This is where you take control. AI gives you a strong foundation—but you refine it.
✅ What You Can Do Easily:
| Action | How It Works |
|---|---|
| Add/remove items | Click “+” or “–” in the editor. Layout auto-adjusts. |
| Edit text/content | Double-click any text box → edit live. |
| Swap icons | Click icon → choose from library. |
| Change colors | Use color picker or preset themes. |
| Re-generate specific sections | Refine prompt (e.g., “Add a 6th benefit about employee retention”) → re-generate only that section. |
🎯 Pro Tip: Use re-generating for structural overhauls, but manual editing for precision tweaks.
🔁 Example Workflow for Expansion:
-
Start with 4 benefits → AI generates.
-
Realize you need 6—add two more items.
-
Layout auto-resizes and repositions all elements.
-
Manually refine the new points for accuracy.
-
Optional: Re-prompt AI to generate updated content for the new sections.
🏁 Result: A polished, cohesive infographic—without hours of manual layout work.
🟦 Step 7: Finalize & Export
Once satisfied:
-
Apply hand-drawn style for a human touch (great for presentations).
-
Choose professional style for reports or client deliverables.
-
Export in:
-
SVG (scalable, ideal for web/print)
-
PNG (high-res, for sharing)
-
PDF (for printing or archiving)
-
-
Share a public link for feedback.
📌 Bonus: Save your template for reuse—perfect for recurring reports or training materials.
📊 Quick Comparison: Traditional vs. Visual Paradigm AI Workflow
| Task | Traditional Tools (Figma, PowerPoint) | Visual Paradigm AI |
|---|---|---|
| Generate 4-item infographic | ✅ Fast | ✅ Very fast |
| Add 2 more items | ❌ Manual resizing, realigning, spacing fixes (15–30 mins) | ✅ Auto-adjusts layout in seconds |
| Change content in one section | ✅ Possible, but breaks alignment if not careful | ✅ Re-generate or edit directly — layout stays intact |
| Reuse template | ❌ Requires rebuilding | ✅ Save & reuse with new data |
| Iteration speed | Slow | Extremely fast |
✅ Verdict: Visual Paradigm reduces design iteration time by up to 80% in dynamic projects.
📌 Best Practices for Smooth, Scalable Design
-
Start Small, Expand Smart
Begin with fewer items (e.g., 4) for rapid ideation. Add more only when needed. -
Treat AI as a Co-Pilot, Not a Oracle
Accept its structure, but always verify facts, logic, and tone. -
Use Real-Time Preview
Test layout behavior with 4 vs. 6 vs. 8 items before generating. -
Combine AI + Manual Editing
Use AI for content generation and layout logic. Use manual edits for storytelling, nuance, and brand alignment. -
Leverage Specialized Templates
Use templates designed for 5, 6, or 8 aspects (e.g., “5 Forces,” “8-Step Innovation Process”) for naturally flexible designs. -
Save Iterative Versions
Keep versions labeled (e.g., “V1 – 4 benefits,” “V2 – 6 benefits”) to track evolution.
🎯 Who Should Use This?
-
Product Managers – Visualize roadmap phases or feature benefits.
-
Educators & Trainers – Create study guides, process charts, or comparison tables.
-
Marketers – Turn complex data into shareable, social-ready infographics.
-
Consultants & Strategists – Build SWOT, PESTLE, or 4-Box models with ease.
-
Presenters – Generate polished visuals for decks, reports, or pitch decks.
📣 Final Thoughts: Design That Evolves With You
Visual Paradigm’s AI Infographic Generator isn’t just about speed—it’s about intelligent adaptability.
It solves the real-world challenge of evolving content:
You start with 4 items → realize you need 6 → expand without breaking layout → refine with confidence.
This hybrid approach—AI for ideation and structure, you for control and storytelling—makes it the ideal tool for modern, iterative design.
🔗 Get Started Today
👉 Try it now: ai.visual-paradigm.com/tool/ai-powered-infographic-generator
📘 Explore templates: Browse the AI-ready gallery
📣 Check release notes: Stay updated on new features like hand-drawn styles, multi-aspect templates, and enhanced auto-layout.
🎁 Pro Tip: Pair this tool with Visual Paradigm’s AI Presentation Generator for a full AI-powered content pipeline—from idea to infographic to presentation.
✅ Summary: Why Visual Paradigm Wins for Evolving Design
-
✅ Auto-adjusting layouts for dynamic item counts
-
✅ Real-time preview for smart iteration
-
✅ Seamless expansion from 4 → 8+ items
-
✅ Hybrid workflow: AI speed + manual control
-
✅ Export in scalable formats (SVG, PDF, PNG)
🚀 Stop designing from scratch. Start evolving from AI.
With Visual Paradigm, your infographic doesn’t just look good—it grows smarter with your idea.