In software architecture, understanding how components interact is as critical as understanding what those components do. When systems grow in complexity, the relationships between objects can become opaque. This is where visual modeling becomes essential. Specifically, the communication diagram offers a unique perspective on object interactions, focusing heavily on the connections and dependencies that drive system behavior. By mapping these relationships clearly, teams can reduce cognitive load and improve maintainability.
This guide explores the practical application of communication diagrams. We will examine their structure, construction, and utility in documenting dependencies. The goal is to provide a clear framework for creating diagrams that serve as effective documentation rather than mere decoration.
🔍 Understanding the Purpose of Visual Dependencies
Dependencies define the contract between software entities. If one part of a system changes, others may need to adapt. Visualizing these links allows architects and developers to see the impact of changes before they occur. A communication diagram focuses on the spatial arrangement of objects and the flow of messages between them.
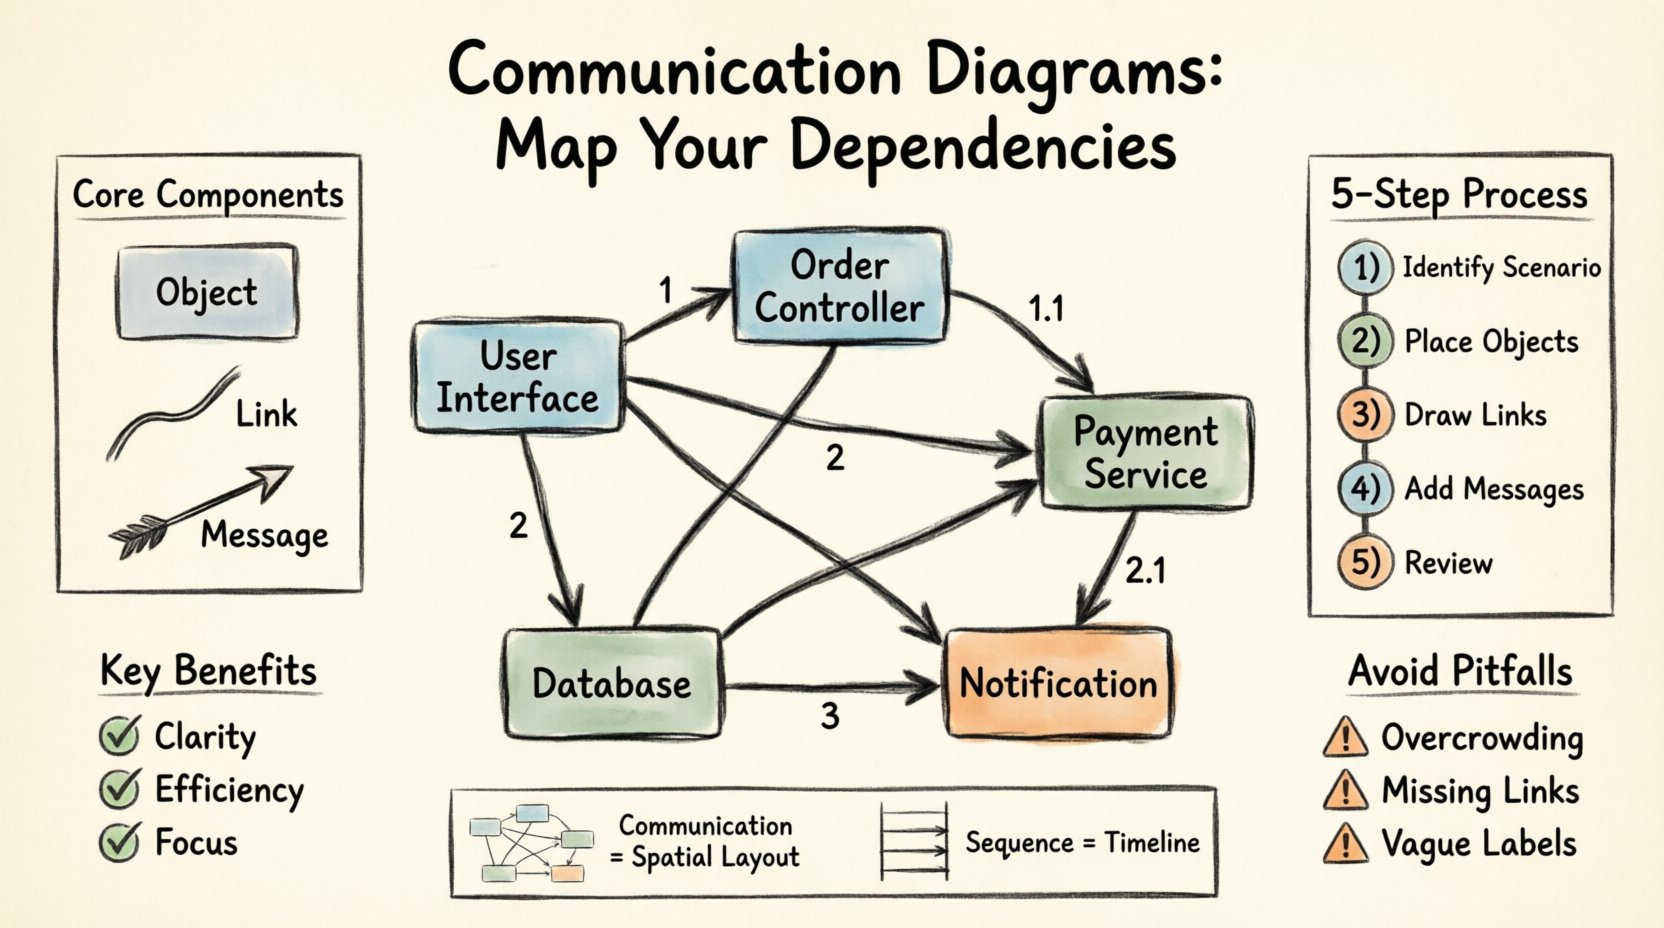
- Clarity: It shows who talks to whom directly.
- Efficiency: It reduces the need to trace lines across a page.
- Focus: It highlights the structural relationships over the temporal sequence.
Unlike other notations that prioritize time, this approach prioritizes the physical or logical layout of the system. This distinction makes it particularly useful for understanding complex object graphs where the order of operations is less important than the connectivity.
⚙️ Core Components of a Communication Diagram
To construct a valid diagram, one must understand the fundamental building blocks. These elements work together to create a complete picture of the interaction.
1. Objects and Instances
Objects represent active elements in the system. They are the participants in the scenario. In a diagram, these are often depicted as rectangles containing the class name or instance name. Each object must have a unique identifier within the context of the diagram to distinguish it from others.
- Role: Defines what the object is doing (e.g., “User Interface”, “Database Handler”).
- Instance: A specific occurrence of a class (e.g., “Order #1234”).
2. Links
Links represent the associations between objects. They are the physical paths over which messages travel. Without a link, a message cannot be sent. This makes the link a critical dependency indicator.
- Direction: Links can be bidirectional or unidirectional.
- Visibility: They imply that one object holds a reference to another.
- Multiplicity: A single object might be connected to many others.
3. Messages
Messages are the actions taken. They represent method calls, events, or data transfers. On the diagram, they appear as arrows connecting objects along the links. Each message is numbered to indicate its sequence in the interaction.
- Parameters: Data passed between objects.
- Return Values: The result of the operation.
- Timing: While the diagram focuses on space, the numbering implies time.
🛠️ Step-by-Step Construction Methodology
Creating a clear diagram requires a systematic approach. Rushing into drawing leads to clutter and confusion. Follow this process to ensure accuracy and readability.
Step 1: Identify the Scenario
Begin with a specific use case. Do not attempt to diagram the entire system at once. Pick a single user journey or system event. For example, consider a “Place Order” scenario.
- What is the trigger?
- Which objects are involved?
- What is the expected outcome?
Step 2: Place the Objects
Draw the objects first. Arrange them based on how they relate to each other logically. Put the initiator on one side and the target on the other. This spatial arrangement helps the viewer understand the flow without reading the numbers yet.
- Use a grid or alignment guides for consistency.
- Keep related objects close together.
- Avoid overlapping boxes.
Step 3: Draw the Links
Connect the objects that interact. Ensure that every message in your scenario has a corresponding link. If Object A needs to talk to Object C, but there is no link, draw one. This step reveals hidden dependencies that might not be obvious in code.
Step 4: Add the Messages
Draw arrows along the links to show the message flow. Label each arrow with the method name or event type. Crucially, add sequence numbers.
- Start with 1 for the initial request.
- Use 1.1, 1.2 for nested calls within the first step.
- Use 2 for the next major step.
Step 5: Review and Refine
Look at the diagram from a fresh perspective. Can you trace the flow easily? Are there crossed lines? Are labels clear? Remove any unnecessary elements. If a link exists but no message is sent, consider if it is needed.
🔢 Managing Message Sequencing and Ordering
Numbering is the mechanism that introduces time into a spatial diagram. It provides the necessary context for the interaction without requiring a vertical timeline like other notations.
Sequential Logic
The numbering must follow a logical progression. It tells the reader what happens first. If Object A calls Object B, and Object B calls Object C, the order must be reflected in the numbers.
- 1: Initial message from the actor.
- 1.1: First internal call triggered by message 1.
- 1.1.1: A sub-call within 1.1.
Parallel Processing
Some systems handle multiple tasks simultaneously. You can represent this by using distinct sequences or noting parallelism in the description. However, keep the numbering simple to avoid confusion.
Return Messages
Not every message is a request. Some are responses. You can represent returns using dashed lines or simply by noting the return in the label. Consistency is key here.
| Element | Visual Representation | Purpose |
|---|---|---|
| Object | Rectangle | Identifies the participant |
| Link | Line connecting objects | Shows structural dependency |
| Message | Arrow with label | Indicates action or data flow |
| Number | Prefix on message label | Defines execution order |
🔄 Distinguishing Communication from Sequence Diagrams
It is common to confuse this diagram type with the sequence diagram. Both model interactions, but they serve different purposes. Understanding the difference helps you choose the right tool for the job.
Layout Differences
- Communication Diagram: Objects are placed in 2D space. The focus is on the relationships and topology.
- Sequence Diagram: Objects are arranged vertically. Lifelines extend downwards. The focus is on the timeline.
Readability Scenarios
- Communication: Better for showing how many objects are involved in a process without showing the exact timing.
- Sequence: Better for showing complex timing, loops, and conditional logic in a linear fashion.
When to Use Which
If you need to show the architectural connections, use the communication diagram. If you need to show the precise timing of events, use the sequence diagram. Often, they are used together. The communication diagram gives the map, and the sequence diagram gives the route.
🚫 Common Pitfalls and How to Avoid Them
Even experienced practitioners make mistakes. These errors can render a diagram useless. Awareness of common traps helps maintain quality.
1. Overcrowding
Trying to show the entire system in one diagram is a mistake. It becomes unreadable quickly. Break down complex systems into smaller, focused diagrams.
- Limit the number of objects per diagram to around 7-10.
- Create a separate diagram for different use cases.
2. Missing Links
If you draw a message but forget the link, the diagram is technically invalid. The link represents the dependency. Without it, the connection is hypothetical.
3. Inconsistent Numbering
Skipping numbers or using non-sequential logic confuses the reader. Always follow a strict hierarchy (1, 1.1, 1.2, 2, etc.).
4. Vague Labels
Labels like “Do It” or “Process” are unhelpful. Use specific method names or action descriptions. Precision reduces ambiguity.
5. Ignoring Return Flows
Showing only the request and ignoring the response can hide critical error handling or data retrieval steps. Always indicate if a return value is expected.
🛡️ Maintaining Diagram Integrity Over Time
Software evolves. Code changes, and the documentation must follow. A static diagram becomes a liability if it no longer matches the system.
Version Control
Treat diagrams like code. Store them in a repository. Commit changes with messages explaining what was updated. This creates an audit trail of architectural decisions.
Review Cycles
Integrate diagram reviews into the development process. When a feature is added, check if the diagram needs updating. Do not leave this for the end of the project.
Simplification
As the system grows, diagrams may become too complex. Refactor them. Group related objects into sub-systems. Use aggregation to hide internal complexity when appropriate.
📋 Best Practices Checklist
Use this checklist to validate your work before sharing it with the team.
- ☐ Are all objects clearly labeled with names?
- ☐ Do all messages have corresponding links?
- ☐ Is the numbering sequence logical and consistent?
- ☐ Are there more than 10 objects? (If yes, split the diagram)
- ☐ Are the labels specific and descriptive?
- ☐ Is the layout clean with minimal line crossing?
- ☐ Does the diagram represent a single, coherent scenario?
- ☐ Are return messages indicated where necessary?
📈 The Value of Clear Dependency Visualization
Investing time in accurate diagrams pays dividends later. When onboarding new developers, these diagrams provide a quick overview of the system structure. When debugging, they help trace the path of data. When planning refactoring, they highlight which changes will cause the most ripple effects.
Dependencies are the backbone of software systems. Visualizing them is not just a documentation exercise; it is a risk management strategy. By using communication diagrams effectively, teams can ensure that their architectural knowledge is preserved and accessible.
🔮 Final Thoughts on System Modeling
Modeling is a discipline that requires practice. Start with small scenarios. Focus on accuracy over speed. As you gain experience, you will find patterns in how objects interact. This insight leads to better design decisions.
Remember that the diagram is a tool for communication, not just a record. If a team member cannot understand it within five minutes, it needs revision. Keep it simple. Keep it clear. Keep it useful.