When designing complex software systems, visualizing how objects interact is just as critical as writing the code itself. One of the most effective tools for this purpose is the UML Communication Diagram. While often overshadowed by Sequence Diagrams, this type of diagram offers a unique perspective on object relationships and message flow. For those new to Unified Modeling Language (UML), understanding when and how to use this specific diagram type can significantly improve system architecture clarity.
This guide addresses the most common inquiries regarding Communication Diagrams. We will explore definitions, structural components, comparisons with other diagram types, and practical application rules. By the end, you will have a clear understanding of how to represent object interactions effectively.
🔍 What Exactly Is a UML Communication Diagram? 🧩
A UML Communication Diagram is a type of interaction diagram. Its primary purpose is to show how objects in a system interact with one another to perform a specific task. Unlike other diagrams that focus heavily on time sequences, this diagram emphasizes the structural organization of objects and the links between them.
Originally known as a Collaboration Diagram in earlier versions of UML, the name was changed to better reflect its focus on the communication path between objects rather than the collaboration process itself. The diagram displays objects as rectangles and the connections between them as lines. Messages are indicated by numbered arrows or lines connecting these objects.
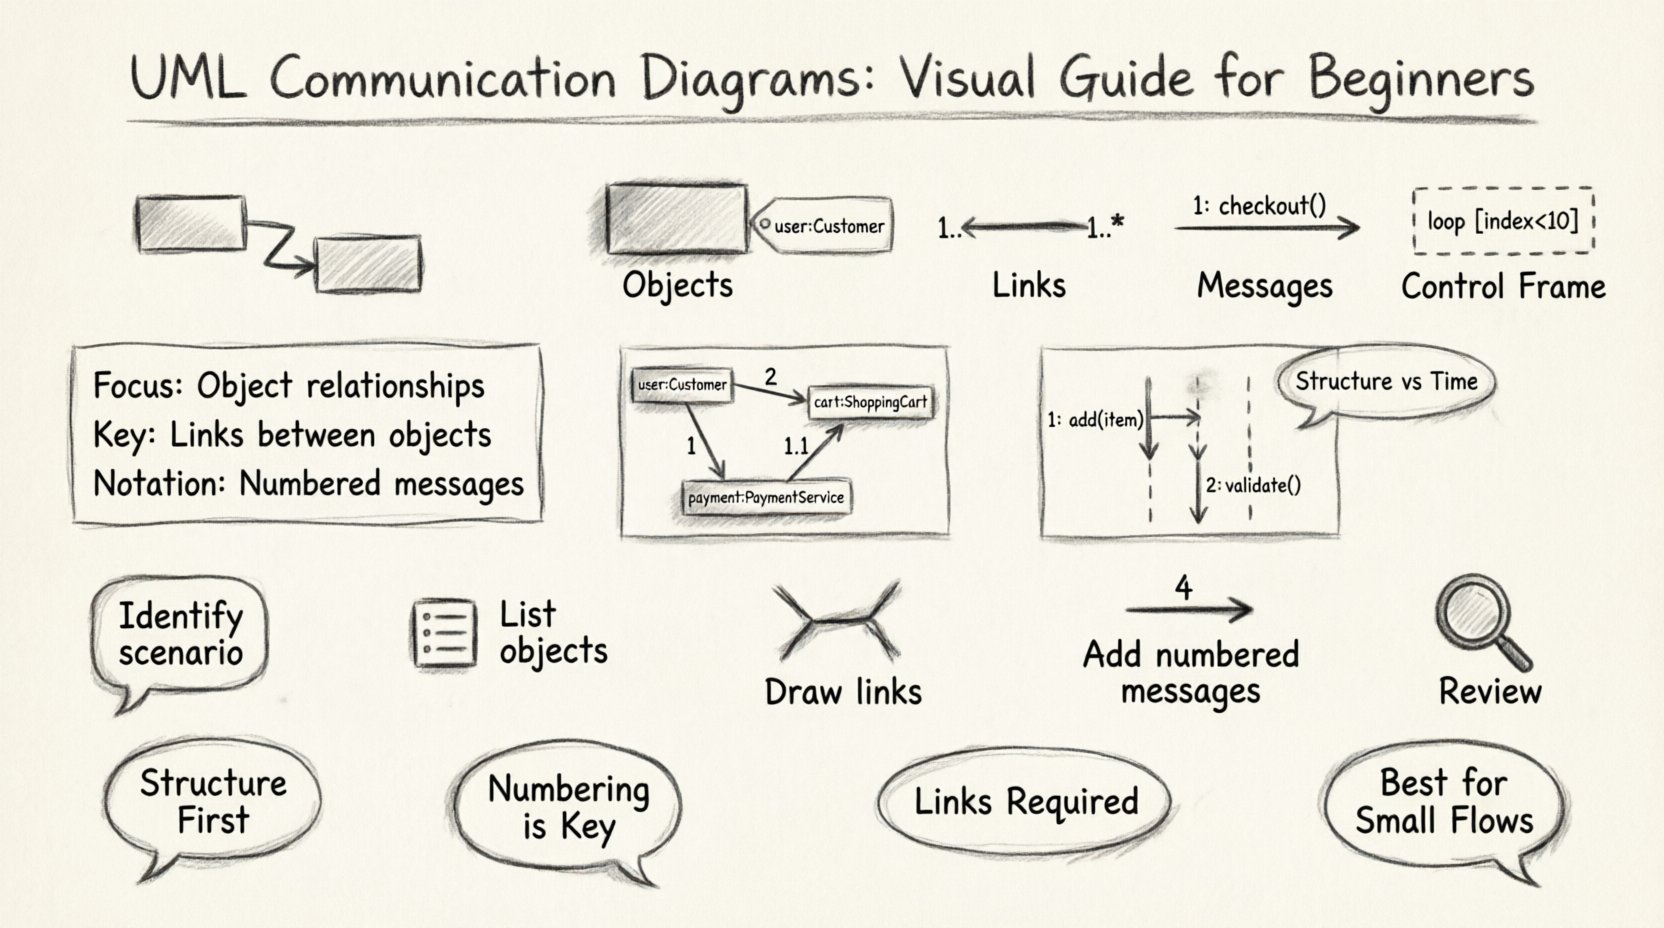
- Focus: Object relationships and message flow.
- Key Element: Links between objects.
- Notation: Numbered messages to indicate order.
- Alternative Name: Interaction Diagram (Collaboration).
This diagram is particularly useful when you need to understand the physical structure of the interaction rather than the strict chronological timing. It allows developers to see which objects talk to which other objects without getting lost in a timeline.
⚖️ How Does It Differ From a Sequence Diagram? 📊
The most frequent question beginners ask involves the comparison between Communication Diagrams and Sequence Diagrams. Both depict interactions, but they prioritize different information. Understanding this distinction is vital for choosing the right tool for your design documentation.
| Feature | Communication Diagram | Sequence Diagram |
|---|---|---|
| Primary Focus | Object structure and links | Time sequence and order |
| Layout | Objects arranged spatially | Objects arranged vertically with lifelines |
| Message Order | Indicated by numbers on links | Indicated by vertical position on lifelines |
| Complexity | Can get messy with many objects | Better for long, complex flows |
| Readability | Good for static relationships | Good for dynamic flow over time |
In a Sequence Diagram, the vertical axis represents time. Messages flow downwards. In a Communication Diagram, the horizontal or spatial arrangement represents the relationship. The order of operations is determined by the numbering on the message arrows (e.g., 1, 1.1, 1.2).
🛠️ What Are the Core Components of This Diagram? 🧱
To draw a valid Communication Diagram, you must understand the specific notation elements used. Each component serves a distinct function in the overall design representation.
1. Objects and Instances
Objects are represented by rectangles. They are typically named using the pattern ObjectName:ClassName. For example, order:Order or user:Customer.
- Instance Names: Appear before the colon (e.g.,
cart). - Class Names: Appear after the colon (e.g.,
ShoppingCart). - Appearance: Often shown with a bold class name if referring to the class generally.
2. Links
Links are solid lines connecting objects. They represent a known association between two objects. This is a crucial distinction; objects must have a link to send messages directly.
- Direction: Links are generally bidirectional unless specified otherwise.
- Multiplicity: Numbers can be added to the link ends (e.g., 1, *) to show how many instances are involved.
- Role Names: You can label the link to describe the role one object plays for the other.
3. Messages
Messages are the interactions between objects. They are drawn as arrows or lines with labels.
- Numbering: Messages are numbered to show the sequence. 1, 2, 3, etc.
- Sub-messages: Nested calls use decimal notation (1.1, 1.2, 2.1).
- Return Messages: Often shown as dashed arrows pointing back to the sender.
- Labels: Should describe the action or method being called.
4. Control Frames
While less common in basic diagrams, frames like loop, alt, and opt can be used to show repetitive or conditional logic. These are drawn as rectangles surrounding the relevant messages.
📝 How Do You Number Messages Correctly? 🔢
One of the most confusing aspects for beginners is the numbering system. Since there is no time axis like in Sequence Diagrams, the numbers tell the story of execution.
The Basic Sequence
Start with 1 for the first message. Continue sequentially (2, 3, 4) for independent actions.
Nested Calls
If Object A sends a message (1) to Object B, and Object B then sends a message to Object C, this second message is a sub-step of the first. It is numbered 1.1. If Object C sends a response, it might be 1.1.1 or 1.2 depending on the flow.
Example Scenario
- 1:
userrequestscheckoutfromcart. - 1.1:
cartrequestscalculateTotalfrompricing. - 1.1.1:
pricingreturnstotaltocart. - 2:
cartsendsconfirmOrdertodatabase.
This structure allows you to read the diagram and understand the call stack without needing a timeline.
🔄 Can Communication Diagrams Show Loops and Conditions? 🔄
Yes, but with some limitations compared to Sequence Diagrams. You can represent loops and alternatives using specific notation.
Loops
To show a loop, you draw a frame around the messages involved. Inside the frame, you label it loop. You can also specify the condition, such as [index < 10].
Alternatives
For conditional logic (if/else), use an alt frame. This frame is divided into sections. Each section is labeled with a condition in brackets. For example, [valid card] and [invalid card].
Best Practices for Logic
- Keep loops simple. If the logic is too complex, consider a Sequence Diagram.
- Use clear conditions in the frame labels.
- Ensure the message numbering remains consistent within the frame.
🚀 When Should You Use a Communication Diagram? 🚦
Choosing the right diagram type depends on what you want to communicate. Here are specific scenarios where this diagram excels.
- Visualizing Object Structure: When you need to show how objects are connected physically in the system.
- Short Interactions: For simple flows involving a few objects, this diagram is cleaner than a Sequence Diagram.
- Navigation Paths: When explaining how a user navigates from one object to another through links.
- Collaboration Focus: When the relationship between objects is more important than the exact timing of messages.
Conversely, if you have a long, linear process with many steps, a Sequence Diagram is usually more readable. If you need to show timing constraints, this diagram is not suitable.
❌ What Are Common Mistakes Beginners Make? 🛑
Even experienced designers make errors. Avoiding these pitfalls will save you time during code reviews and system planning.
1. Missing Links
Do not draw arrows between objects that do not have a direct link. If Object A talks to Object C, there must be a link line between them. If they only communicate via Object B, Object A should talk to B, and B to C.
2. Inconsistent Numbering
Ensure your numbering is logical. If you jump from 1 to 5 without explaining 2, 3, and 4, the reader will be confused. Use sub-numbers correctly for nested calls.
3. Overcrowding
Do not put too many objects on one page. If the diagram becomes a tangled web of lines, it loses its purpose. Split the interaction into multiple diagrams if necessary.
4. Ignoring Return Messages
While not always mandatory, showing return messages helps clarify the flow of data. If Object A calls Object B, does Object B return a value? Indicate this with a dashed line.
5. Vague Labels
Avoid generic labels like do something. Be specific. Use processPayment or fetchUserDetails. This makes the diagram useful for developers implementing the code.
📐 How Do You Draw Links and Multiplicity? 📏
Links define the structural relationship. Multiplicity defines how many instances can be connected.
| Multiplicity | Meaning |
|---|---|
| 1 | Exactly one instance |
| 0..1 | Zero or one instance |
| 1..* | One or more instances |
| * | Zero or more instances |
Place these numbers at the end of the link line closest to the object they describe. This clarifies the cardinality of the relationship.
🛠️ Step-by-Step Guide to Creating One 📝
Follow this process to ensure your diagram is accurate and useful.
- Identify the Scenario: Decide what specific interaction you are modeling (e.g., User Login).
- List the Objects: Identify all objects involved in this interaction.
- Draw the Objects: Place them on the canvas. Group related objects together.
- Draw the Links: Connect objects that need to communicate directly.
- Add Messages: Draw arrows between connected objects to show the flow of information.
- Number the Messages: Assign numbers to indicate the order of execution.
- Review: Check for missing links, confusing numbers, or unclear labels.
💡 Tips for Maintaining Readability 🔍
A diagram that is hard to read is useless. Keep these tips in mind during the design process.
- Use White Space: Don't crowd objects. Allow breathing room between elements.
- Color Coding: While standard UML is black and white, using colors to distinguish object types (e.g., Controllers vs. Models) can help.
- Grouping: Use frames to group related messages together.
- Legend: If you use non-standard symbols, provide a legend.
- Consistency: Use the same naming convention for all objects across all diagrams in the project.
🎓 Summary of Key Takeaways 📌
Communication Diagrams are a powerful tool for visualizing object interactions. They prioritize the structure of connections over the timeline of events.
- Structure First: Focus on how objects are linked.
- Numbering is Key: Use sequential numbers to define order.
- Links Required: Messages must follow existing links.
- Best for Small Flows: Use Sequence Diagrams for complex timelines.
- Clarity Over Detail: Keep labels specific but concise.
By mastering the nuances of this diagram type, you can improve communication between designers, developers, and stakeholders. It provides a clear map of the system's object interactions without the clutter of a full timeline.
🤝 Final Thoughts on UML Modeling 🌟
Effective modeling is about clarity, not perfection. Whether you choose a Communication Diagram or a Sequence Diagram, the goal is to reduce ambiguity in the design. Take the time to review your diagrams with peers. Ask if the message flow makes sense. Check if the links represent actual code dependencies.
Remember that diagrams are living documents. As the system evolves, update your diagrams to reflect the new reality. This practice ensures that the documentation remains a valuable asset throughout the software development lifecycle.