Software development is often described as a conversation between logic and reality. Yet, when that conversation is conducted solely through text, ambiguity creeps in. Developers read, stakeholders imagine, and the gap between expectation and implementation widens. This is where visual modeling becomes essential. Specifically, translating textual requirements into a Communication Diagram allows teams to map object interactions with precision.
This guide explores the mechanics of converting written specifications into a visual representation of system behavior. We will examine the cognitive benefits of diagrams, the structural rules of the notation, and the practical steps required to ensure accuracy without relying on proprietary tools.
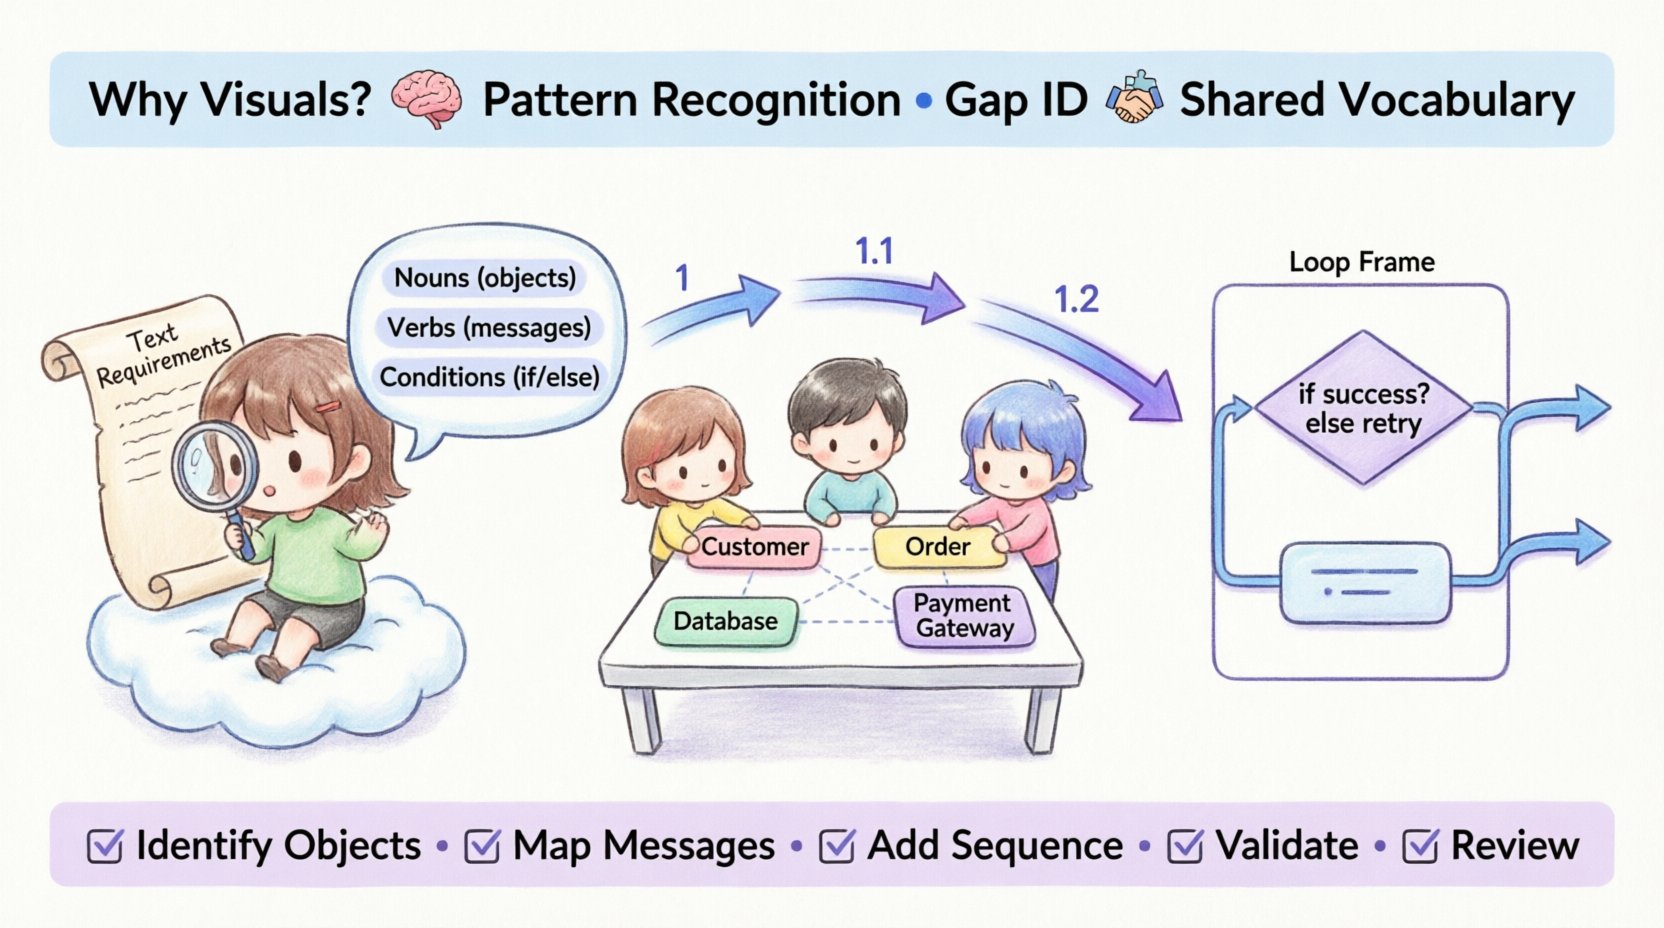
Why Visuals Outperform Text 🧠
Text is linear. It flows from top to bottom, left to right. However, software systems are rarely linear. They are networks of objects interacting in parallel, sequentially, and conditionally. A paragraph describing a login process might miss a concurrency issue that a diagram highlights immediately.
When requirements are purely textual, the reader must mentally construct the architecture. This imposes a high cognitive load. Visual models offload this work. They externalize the mental model, allowing multiple stakeholders to inspect the same structure simultaneously.
- Pattern Recognition: Humans process images faster than text. A communication diagram reveals loops and branches instantly.
- Gap Identification: Missing links between objects become obvious when drawn out.
- Shared Vocabulary: Diagrams create a common language for business analysts and engineers.
Understanding the Communication Diagram 📊
A Communication Diagram, sometimes referred to as a Collaboration Diagram in older standards, focuses on the relationships between objects and the messages they exchange. Unlike a Sequence Diagram, which emphasizes the order of time, a Communication Diagram emphasizes the structural connections.
Core Components
To translate requirements effectively, one must understand the building blocks:
- Objects: Instances of classes. Represented as boxes with the object name underlined.
- Links: Connections between objects. These represent the relationships or associations defined in the requirements.
- Messages: Signals sent from one object to another. These drive the logic of the system.
- Sequence Numbers: Labels on messages (1, 1.1, 1.2) that indicate the order of execution.
Phase 1: Analyzing the Textual Requirements 📝
Before drawing a single line, the source material must be dissected. This phase is about extraction. You are looking for nouns, verbs, and conditions hidden within the prose.
Identifying Objects
Scan the requirement document for nouns. These are potential objects.
- Requirement: “The Customer submits an Order.”
- Extraction: Customer, Order.
Do not assume every noun is an object. Some are data types or attributes. Distinguish between the actor (who interacts) and the entity (what is interacted with).
Identifying Actions
Verbs indicate messages. Look for actions performed by or on the objects.
- Requirement: “The system validates the payment details.”
- Extraction: Message: validatePayment.
Identifying Conditions
Logic flows are often buried in “if” or “then” statements. These dictate alternative paths in the diagram.
- Requirement: “If the stock is low, notify the warehouse.”
- Extraction: Conditional path to Warehouse object.
Phase 2: The Translation Workflow 🛠️
Once the elements are extracted, the actual translation begins. This process is iterative and requires a structured approach to maintain fidelity to the original requirements.
Step 1: Define the Scope
Not every requirement needs a diagram. Select the critical paths. Focus on the primary business flow. Avoid cluttering the diagram with edge cases that do not affect the core logic.
Step 2: Place the Objects
Arrange the identified objects on the canvas. Spatial relationships matter less than connectivity, but grouping related objects can improve readability. Place external systems (like payment gateways) on the periphery to distinguish them from internal components.
Step 3: Draw the Links
Connect the objects based on the requirements. If Object A needs to call Object B, draw a link between them. This link represents the structural dependency.
Step 4: Assign the Messages
Label the links with the message names. Use arrows to indicate direction. Add sequence numbers to denote the flow of control.
Mapping Text to Visual Elements 🔄
The following table illustrates how specific textual patterns translate into diagrammatic elements.
| Textual Pattern | Visual Element | Example |
|---|---|---|
| Noun (Actor) | Object Node | User logs in |
| Noun (System Entity) | Object Node | Database stores data |
| Verb (Action) | Message Arrow | Save record |
| Condition (If/Else) | Alternative Path | If valid, continue; else error |
| Loop (For/While) | Frame or Loop Label | Process each item |
Phase 3: Handling Complex Logic ⚙️
Simple flows are easy to diagram. Real-world requirements often involve complexity. This section details how to handle iterations, recursion, and exceptions.
Handling Loops
When a requirement states “Process all items in the list,” the diagram must reflect repetition. In a Communication Diagram, this is often shown with a loop frame surrounding the interaction. Alternatively, the message can be repeated visually with a sequence number indicating iteration.
- Text: “Iterate through the cart and calculate totals.”
- Visual: A loop frame encompassing the Cart and Calculator interaction.
Handling Exceptions
Textual requirements often hide failures. “The system returns an error if the file is missing.” This is a critical path that must be visible.
- Create a separate branch for the error state.
- Label the message clearly (e.g., throwException or handleError).
- Ensure the object receiving the error is connected appropriately.
Concurrent Messages
Some systems operate in parallel. If the requirements state “Send email and SMS simultaneously,” the diagram should show these messages originating from the same point but moving to different targets without a strict sequence number between them.
Validation and Consistency Checks ✅
Once the diagram is drafted, it must be validated against the source text. This step ensures nothing was lost in translation.
The Walkthrough Method
Read the requirements aloud while tracing the path on the diagram. If you stumble or cannot find a step in the visual, the translation is incomplete.
- Check Object Presence: Did every object mentioned in the text appear in the diagram?
- Check Message Flow: Do all actions have a corresponding arrow?
- Check Logic: Are the conditions and loops represented accurately?
Consistency with Class Diagrams
If a Class Diagram exists, the Communication Diagram must align with it. The objects in the communication diagram must exist as classes or instances in the structural model. If a message is sent to a method that does not exist in the class definition, the diagram reveals a gap in the design.
Common Pitfalls to Avoid 🚫
Even experienced architects make mistakes when translating text to visuals. Awareness of these common errors improves the quality of the output.
- Over-Cluttering: Trying to put the entire system into one diagram makes it unreadable. Split complex flows into multiple diagrams focused on specific scenarios.
- Ignoring Multiplicity: Text might say “List of users.” The diagram should reflect that one object can trigger messages to many instances. Use notes or frames to indicate multiplicity.
- Static Links: Ensure links represent dynamic communication paths, not just static relationships. A link exists because one object needs to call another, not just because they are related in the database.
- Missing Return Messages: While often implicit, important return values should be shown, especially if the logic depends on the response.
Collaboration and Review 🤝
The diagram is not a final deliverable; it is a communication tool. Its value lies in the discussion it sparks.
Stakeholder Review
Present the diagram to business stakeholders. Ask them if the flow matches their understanding of the business process. They may notice logical gaps that engineers miss.
- Business Logic: Does the order of operations make sense?
- Terminology: Do the labels match the business language?
Technical Review
Present to the development team. Ask if the interactions are feasible within the architecture.
- Performance: Are there too many synchronous calls?
- Dependencies: Are the links realistic?
Iterative Refinement 🔄
Requirements change. As they do, the diagrams must evolve. This is not a sign of failure; it is a sign of a living model.
Version Control
Keep track of changes. If a requirement updates the flow, update the diagram and note the change. This history helps in debugging future issues.
Documentation Linkage
Link the diagram to the specific requirement IDs. If Requirement ID 105 changes, the diagram should indicate which section is affected. This traceability is crucial for maintenance.
Conclusion on Visual Translation 🏁
Translating text to a Communication Diagram is an act of synthesis. It requires understanding the narrative of the requirements and reconstructing it into a structural map. By following the steps outlined here—analysis, mapping, validation, and review—teams can ensure their visual models are accurate, useful, and robust.
The goal is not merely to draw lines. The goal is to create a shared understanding that reduces risk and accelerates development. When text and visuals align, the path from concept to code becomes clear.
Summary of Best Practices
- Start with clear requirements.
- Identify objects and messages explicitly.
- Use sequence numbers to define order.
- Validate against the source text.
- Keep diagrams focused and modular.
- Review with both business and technical teams.
By adhering to these principles, the transition from abstract text to concrete visual becomes a reliable process, strengthening the foundation of the entire software project.