


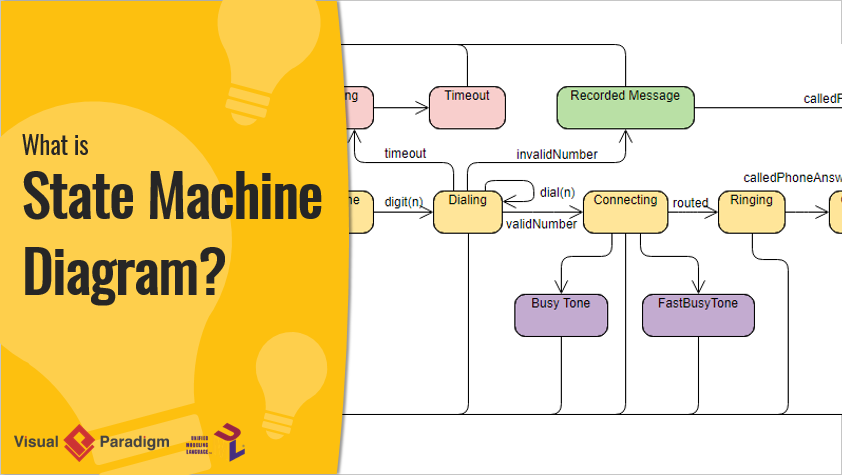
Introduction to State Machine Diagrams
In the complex world of software architecture and system design, the behavior of an entity is rarely static. An object’s response to an input often depends heavily on its history and its current context. To effectively model this dynamic nature, developers and architects rely on the UML State Machine Diagram (traditionally known as a finite state machine or state chart).
This guide provides a comprehensive look at state machine diagrams, exploring their definition, core notation, and advanced concepts. Furthermore, we will examine how modern tools like Visual Paradigm are revolutionizing the creation of these models through AI-powered diagram generation.
What is a State Machine Diagram?
A state machine diagram is a Unified Modeling Language (UML) behavioral diagram used to define the state-dependent behavior of an object. Unlike a flowchart that depicts a process, a state machine focuses on the lifecycle of an entity. It maps out the various states an object can inhabit and the transitions that occur between those states in response to specific events.
Why Use State Machine Diagrams?
State machine diagrams are essential when an object responds differently to the same event depending on its current status. They are commonly applied to classes, subsystems, or entire systems to ensure logical consistency.
Consider a bank account as a practical example:
- Positive State: If you possess $100,000 and withdraw $50, the transaction succeeds, and the balance decreases. The behavior is standard.
- Negative State: If the account is overdrawn, the same “withdraw” event might trigger a different behavior, such as a rejection or an overdraft fee.
In this scenario, a transition occurs from a positive state to a negative state based on the specific conditions (business rules) defined in the system. Modeling this ensures that developers account for every possible scenario in the object’s lifecycle.
Core Concepts and Notation
To read or create a state machine diagram, one must understand its fundamental building blocks defined by UML standards.
1. States
A state represents a condition or situation during the life of an object where it satisfies a constraint, performs an activity, or waits for an event. Rumbaugh defines a state as an abstraction of attribute values and links. Visually, states are typically represented by rounded rectangles.
Key Characteristics of a State:
- It occupies a specific interval of time.
- It is often associated with the abstraction of attribute values.
- It represents a period where the object is waiting for an input or performing an ongoing activity.
2. Initial and Final States
Every lifecycle has a beginning and, usually, an end.
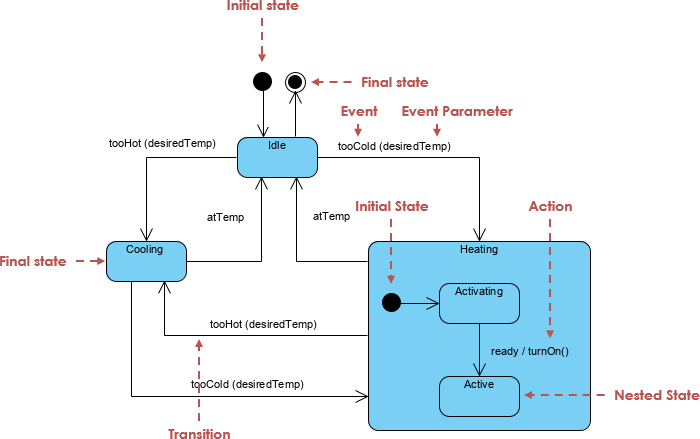
- Initial State: Depicted as a solid filled circle. This pseudo-state marks the starting point of the state machine.
- Final State: Depicted as a circle surrounding a smaller solid circle (bullseye). This indicates the object or system execution has terminated.
3. Transitions
Transitions are the directed lines that connect states, representing the movement from one state to another. A transition is triggered by an event and may involve an action. The flow generally follows this sequence:
- The element is in a Source State.
- An Event occurs.
- An Action is performed (optional).
- The element enters the Target State.
4. Events
Events are the triggers that drive the state machine. They appear on the transition lines or within the internal compartments of a state. There are four primary types of events:
- Signal Event: Arrival of an asynchronous message.
- Call Event: Arrival of a procedural call to an operation.
- Time Event: Occurs after a specific duration has elapsed.
- Change Event: Occurs whenever a specific condition becomes true.
Advanced Modeling Elements
For complex systems, basic states and transitions are often insufficient. UML provides advanced notations to handle hierarchy and concurrency.
Actions vs. Activities
It is crucial to distinguish between actions and activities within a state:
- Action: An atomic, non-interruptible computation (e.g., creating an object, sending a signal). Actions can be triggered on entry (
Entry / action), on exit (Exit / action), or during a transition. - Activity: A non-atomic, ongoing computation that occurs while the object resides in a state (
Do / activity). Activities take time and can be interrupted by events.
Composite and Substates
To simplify complex diagrams, states can be nested. A Composite State contains substates. For example, a “Heater” system might have a general “Running” state, which internally contains substates like “Heating” and “Cooling.” This hierarchy allows designers to hide details and focus on high-level logic when necessary.
Concurrent States
When an object performs two distinct workflows simultaneously, Concurrent States are used. For instance, in an auction process, a system might simultaneously “Process a Bid” and “Authorize Payment Limits.” These are modeled using dashed lines dividing a composite state into regions, or via Fork and Join bars to split and merge execution threads.
Accelerating Design with AI Generation
Traditionally, creating these diagrams required manual drawing and meticulous layout management. However, modern tools like Visual Paradigm have introduced AI-driven workflows to streamline this process.
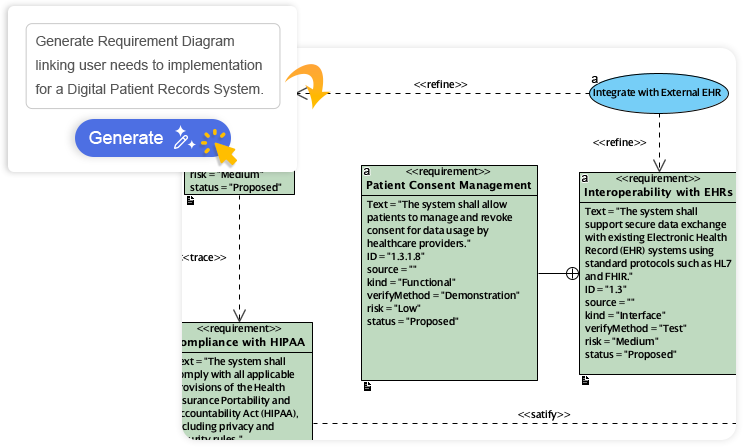
Text-to-Diagram Capabilities
Visual Paradigm’s AI features allow users to generate professional diagrams instantly from text descriptions. Instead of dragging and dropping shapes, a user can simply describe the system requirements. For example, typing “An ATM system handling valid PINs, balance checks, and cash dispensing” can automatically generate a structured state machine diagram.

Benefits of AI-Powered Diagramming:
- Speed: Turns ideas into visual models instantly, removing the manual labor of drawing.
- Contextual Understanding: The AI interprets intent, fills in missing details, and suggests relationships to expand ideas into accurate diagrams.
- Automated Layout: AI ensures diagrams are clean, balanced, and readable with perfect alignment.
- Full Customization: The generated diagrams are fully editable. Users can refine names, move shapes, and adjust styles after the AI provides the head start.
Supported Diagram Types
Beyond state machine diagrams, this AI technology supports a vast array of modeling types, including:
- UML Diagrams: Class, Sequence, Use Case, Object, and Activity diagrams.
- Agile Models: User Story Maps, Scrum Process Canvas.
- Business Modeling: BPMN, Organization Charts, and Decision Tables.
- UX Design: Wireframes, User Journey Maps, and Site Maps.
Conclusion
State Machine Diagrams remain a cornerstone of system analysis and design, providing a clear method for documenting the complex, event-driven behavior of objects. Whether utilizing traditional manual modeling techniques or leveraging the cutting-edge AI generation features of tools like Visual Paradigm, mastering state machines is essential for turning complex logic into successful software projects. By combining theoretical knowledge of states, transitions, and events with modern automation, architects can ensure their designs are both accurate and efficient.