


Introduction to UML Class Diagrams
In the world of software engineering, visualizing the architecture of a system is as critical as writing the code itself. The Unified Modeling Language (UML) Class Diagram stands as the cornerstone of object-oriented design (OOD). It is a static structure diagram that describes the structure of a system by showing the system’s classes, their attributes, operations (or methods), and the relationships among objects.
A class diagram serves as a blueprint. Just as an architect creates a blueprint before a building is constructed, software architects use class diagrams to map out the structure of software before coding begins. This visual representation helps clarify responsibilities, highlight dependencies, and ensure the architecture is consistent and well-organized.
The Anatomy of a Class
At the heart of the diagram is the Class itself. A class represents a concept which encapsulates state (attributes) and behavior (operations). In standard UML notation, a class is depicted as a rectangle divided into three horizontal partitions.
1. Class Name
The top partition contains the name of the class. This is the only mandatory information required to represent a class. Abstract classes are typically denoted by writing the name in italics.
2. Attributes
The middle partition lists the attributes, which represent the state or data of the class. Attributes map onto member variables in the code. The standard format for an attribute is:
- Visibility Name : Type
3. Operations (Methods)
The bottom partition lists the operations, which represent the behavior or services the class provides. These map onto class methods in the code. The standard format usually includes the visibility, name, parameters, and return type.
Visibility Markers
UML uses specific symbols to denote the visibility of attributes and operations, determining who can access them:
- + (Public): Accessible from any other class.
- – (Private): Accessible only from within the class itself.
- # (Protected): Accessible from the class and its subclasses.
Understanding Relationships Between Classes
The power of a UML class diagram lies not just in the classes themselves, but in how they interact. Defining these relationships correctly allows the diagram to convey precisely how code should be implemented.
Inheritance (Generalization)
Inheritance is a taxonomic relationship between a general classifier (superclass) and a specific classifier (subclass). It represents an “is-a” relationship. For example, a “Dog” is an “Animal.” In UML, this is drawn as a solid line with a hollow triangle arrowhead pointing to the parent class. The specific classifier inherits the features (attributes and methods) of the general classifier.
Association
An association represents a structural link between two peer classes. It is usually a solid line connecting two classes, often labeled with a verb to describe the relationship. Cardinality (or multiplicity) can be defined at the ends of the line to indicate numerical relationships, such as “one-to-one,” “one-to-many,” or “many-to-many.”
Aggregation
Aggregation is a special type of association that represents a “part-of” relationship. Importantly, in aggregation, the part can exist independently of the whole. For example, a “Player” is part of a “Team,” but if the team is dissolved, the player still exists. This is depicted by a solid line with a hollow diamond at the end connected to the aggregate (the whole).
Composition
Composition is a stronger form of aggregation. It implies a strong lifecycle dependency where the part cannot exist without the whole. If the whole is destroyed, the parts are destroyed as well. For example, a “House” is composed of “Rooms.” If the house is demolished, the rooms cease to exist. This is shown with a solid line and a filled diamond at the composite end.
Dependency
A dependency indicates that one class uses another, often temporarily. This exists if changes to the definition of one class (the supplier) might cause changes to the other (the client). For instance, if an object is passed as a parameter to a method but not stored as a field, it is a dependency. This is drawn as a dashed line with an open arrow.
Realization
Realization is the relationship between an interface and the implementing class. The class is said to “realize” or implement the behavior defined by the interface. This is depicted as a dashed line with a hollow triangle pointing to the interface.
Perspectives of Class Diagramming
Depending on the stage of development, class diagrams can be drawn from different perspectives:
- Conceptual Perspective: Represents concepts in the domain. It is high-level and language-independent.
- Specification Perspective: Focuses on the interfaces and Abstract Data Types (ADTs). It looks at the software interface rather than implementation details.
- Implementation Perspective: Describes exactly how classes will implement their interfaces, often including specific language details.
Modern Tools: From Manual Drawing to AI Generation
Creating UML diagrams has evolved from whiteboard sketches to sophisticated software solutions. Today, developers can choose between robust manual editors and AI-powered generators.
Free Manual Editors
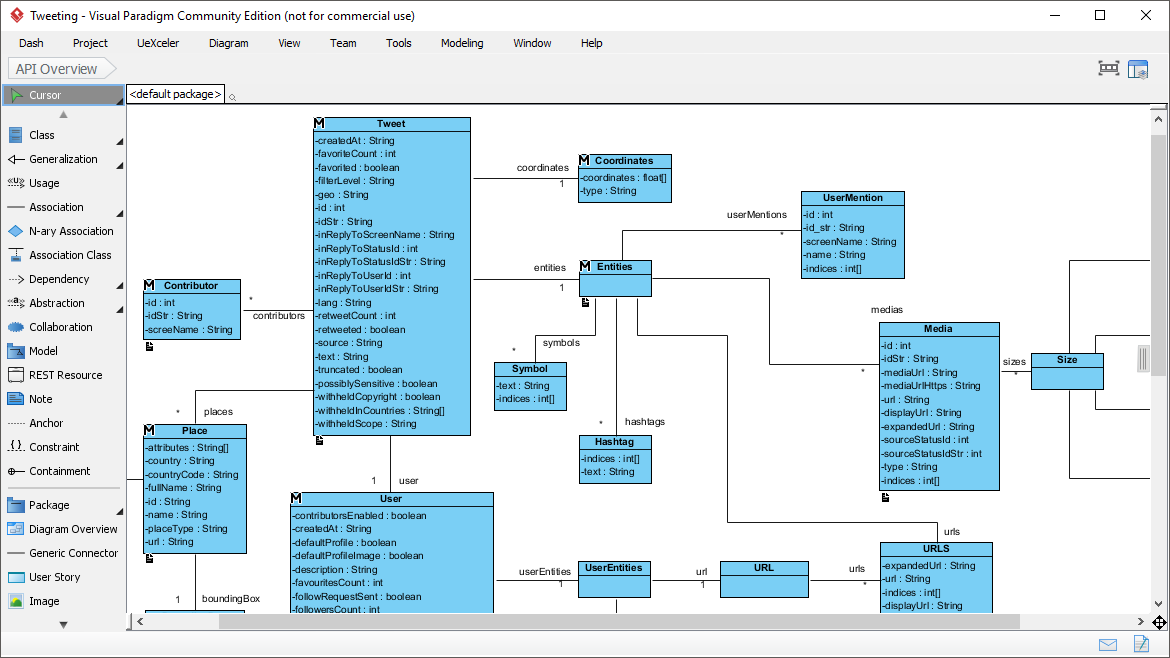
Tools like Visual Paradigm Online provide free, web-based editors that allow for drag-and-drop creation. These tools offer unlimited diagrams and shapes, making them ideal for personal use. They support creating specific examples like Sales Order Systems or Star-Based LAN configurations with precise alignment guides and formatting options.
AI-Assisted Generation
Artificial Intelligence has revolutionized UML modeling by reducing manual effort. There are two primary AI workflows currently available:
1. The 10-Step Wizard
This approach guides users through a structured workflow. It starts with defining the scope and purpose, then moves to identifying classes, defining attributes and operations, and establishing relationships. The AI can suggest scopes, generate summary notes, and even provide an architectural critique to ensure design quality. This eliminates the need to learn complex syntax (like PlantUML) while ensuring structural correctness.
2. The AI Chatbot
For a more conversational approach, AI Chatbots allow users to generate diagrams via text prompts. A user might type, “Create a class diagram for an E-Voting System,” and the AI instantly renders the diagram. Users can then refine the model by conversing with the AI, asking it to “add a relationship between Voter and Ballot” or “identify missing classes.” This turns the tool into an analytical assistant that not only draws but helps think through the design.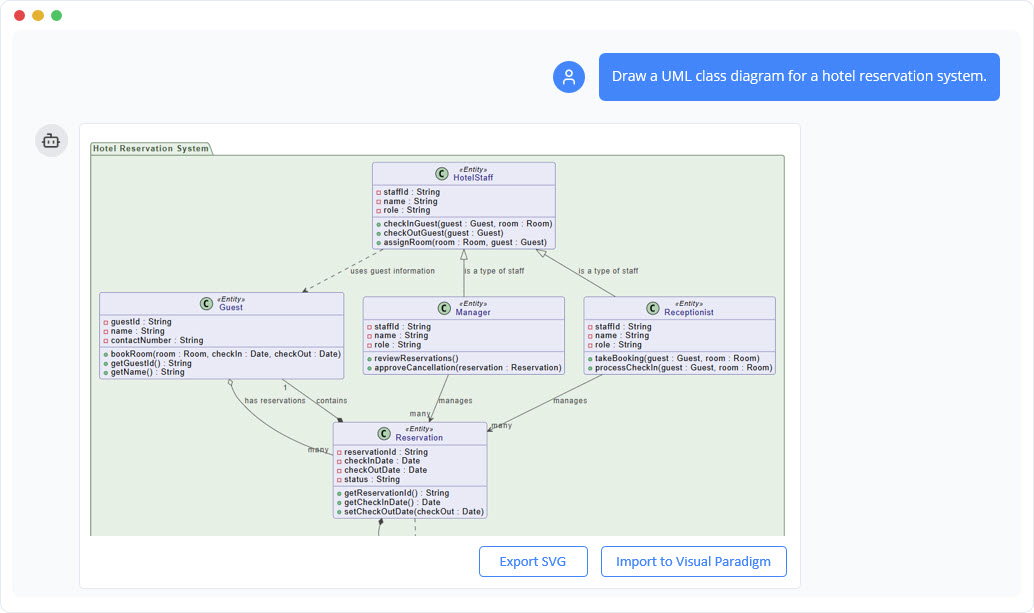
Conclusion
Whether you are a student learning Object-Oriented Design, a business analyst validating requirements, or a software architect documenting a complex system, the UML Class Diagram is an indispensable tool. It bridges the gap between conceptualization and implementation. With the advent of AI-assisted tools, creating these diagrams has never been faster or more accessible, allowing teams to focus less on drawing lines and more on solving architectural challenges.