Now Reading: The C4 Model: A Comprehensive Guide to Visualizing Software Architecture
-
01
The C4 Model: A Comprehensive Guide to Visualizing Software Architecture


The C4 Model: A Comprehensive Guide to Visualizing Software Architecture
Visualizing software architecture is a critical challenge in modern engineering. As systems grow in complexity, the ability to communicate structure, interactions, and dependencies effectively becomes paramount. The C4 model offers a standardized, hierarchical approach to diagramming that solves the common problem of ambiguous or overly complex architecture diagrams. By using four distinct levels of abstraction, the C4 model allows technical and non-technical stakeholders to navigate a software system from a high-level overview down to the code itself.
Key Concepts
Before diving into the specific levels of the C4 model, it is essential to define the foundational terminology used within this framework. Understanding these terms ensures clarity when creating or interpreting the diagrams.
- Abstraction: The practice of hiding complex details to provide a clearer overview. The C4 model relies on differing levels of abstraction to suit different audiences.
- Hierarchical Visualization: A method of organizing diagrams where one level ‘zooms in’ to the next, similar to nested maps.
- Container: In the C4 context, this does not refer solely to Docker. A container is any separately runnable or deployable unit (e.g., a database schema, a server-side application, a mobile app).
- Component: A logical grouping of code within a container, such as a controller, service, or repository.
- Personas/Actors: The human users or roles that interact with the software system.
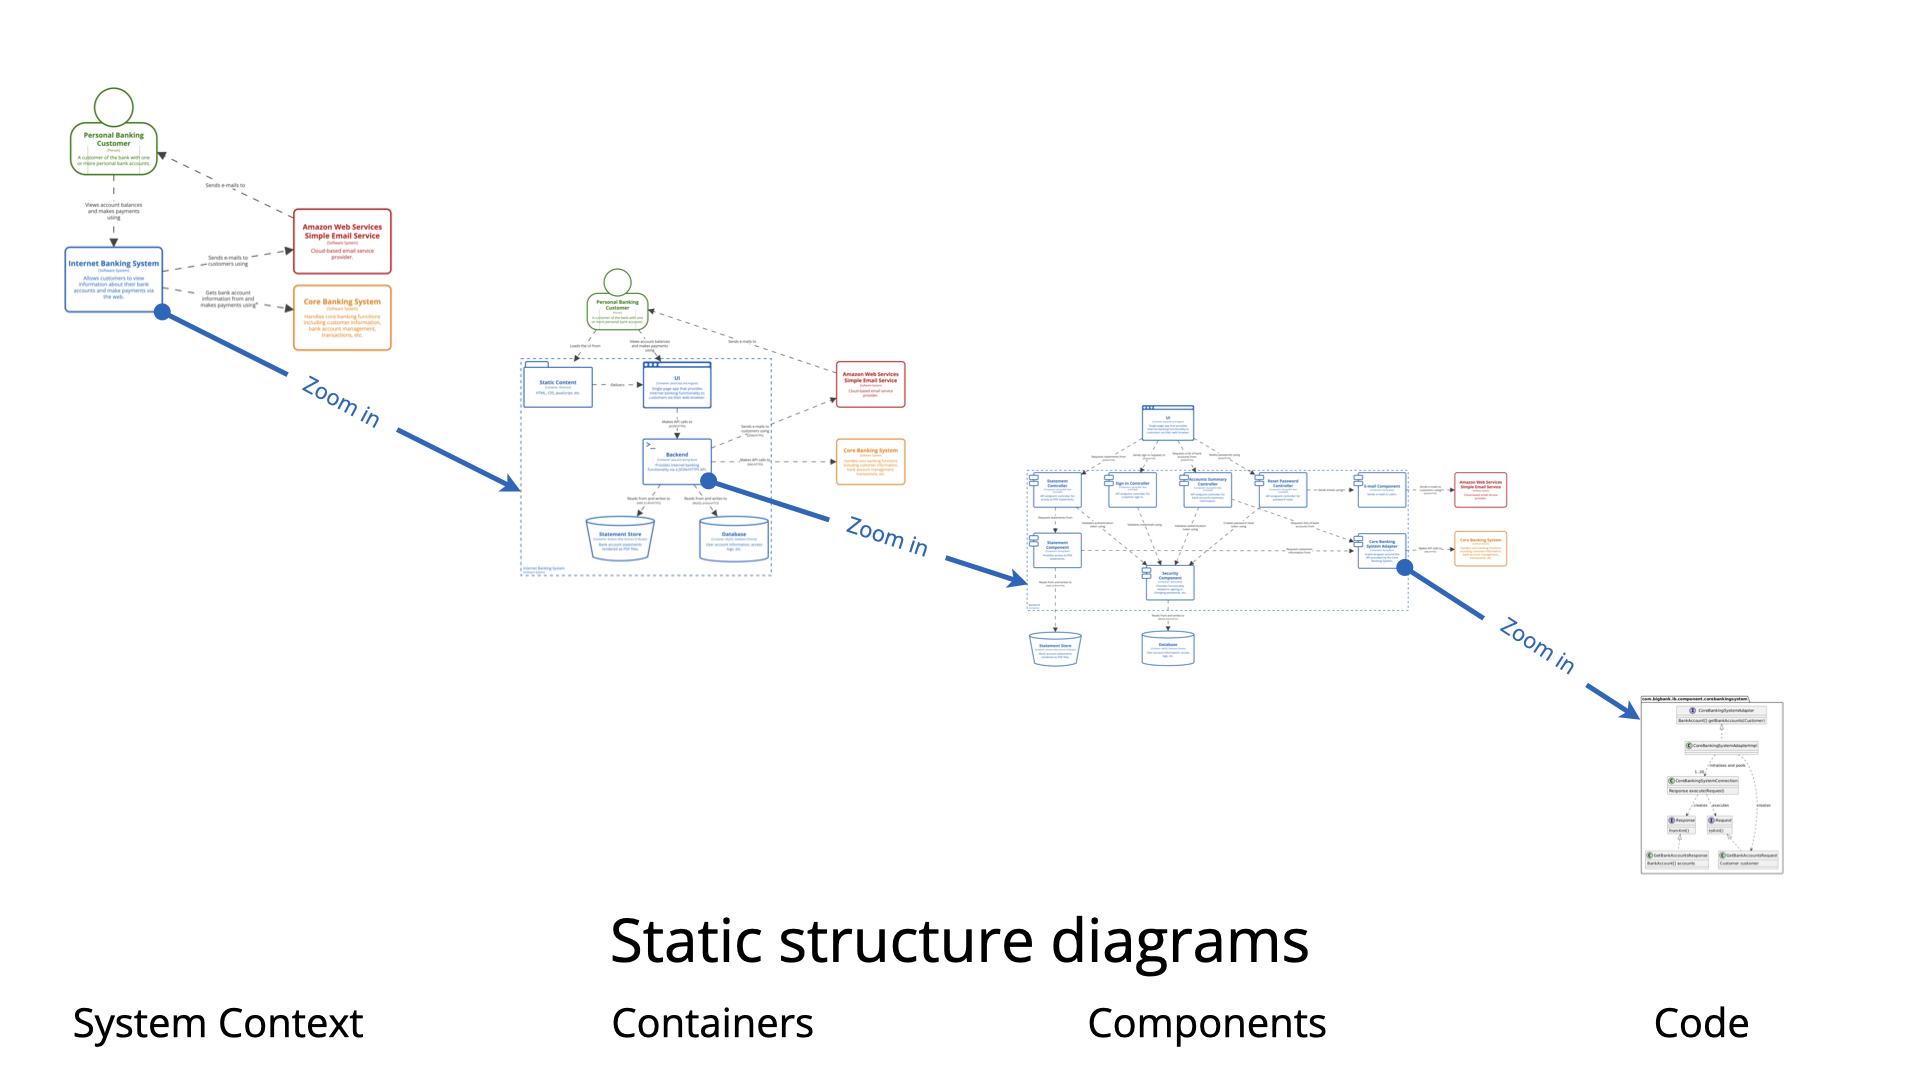
The Four Hierarchical Levels of the C4 Model
The power of the C4 model lies in its ability to tell a story about the software at different zoom levels. Each level addresses a specific set of questions for a specific audience.
Level 1: System Context Diagram
The System Context Diagram acts as the entry point for understanding the software. It provides a “bird’s-eye view” of the system within its broader environment. The primary goal at this level is to define the system’s scope and its relationships with the outside world.
This diagram depicts the system in scope at the center, surrounded by external actors (users, administrators, customers) and external software systems (third-party APIs, legacy mainframes, or external data providers). Crucially, Level 1 diagrams avoid technical minutiae. They do not discuss protocols, databases, or cloud infrastructure. This makes them ideal for conversations with non-technical stakeholders, product owners, and business analysts.

Level 2: Container Diagram
Once the context is established, the Container Diagram zooms in to reveal the high-level technical shape of the system. Here, the single box representing the system in Level 1 is expanded to show the containers inside it.

A container represents a deployable unit. This diagram is vital for software architects and operations teams because it highlights major technology choices. It answers questions such as:
- Is this a microservices architecture or a monolith?
- What data storage technologies are being used (e.g., SQL vs. NoSQL)?
- How do the mobile app, web application, and API communicate (e.g., HTTPS/JSON, gRPC)?
Level 3: Component Diagram
Level 3 takes a single container from the previous level and decomposes it into its internal logical building blocks. This is the Component Diagram. It maps out the major modules, such as a “Payment Processor,” “User Authentication Service,” or “Email Dispatcher.”

This view is primarily designed for the development team. It shows the responsibilities of each component and the implementation details of how they interact. While it does not show line-by-line code, it provides enough detail to prevent architectural drift during implementation.
Level 4: Code Diagram
The deepest level of the C4 model is the Code Diagram. This level corresponds to the implementation details usually visualized using UML Class Diagrams or Entity Relationship Diagrams (ERDs). It displays interfaces, classes, methods, and attributes.
In modern practice, maintaining Level 4 diagrams manually is rarely recommended due to the high rate of code churn. These diagrams are best generated automatically by IDEs or documentation tools when specific, complex logic needs to be analyzed on an ad-hoc basis.
The “Google Maps” Analogy
To better understand how these levels relate to one another, the C4 model is often compared to a digital map application. This analogy helps stakeholders conceptualize the zoom function of the architecture:
- Level 1 (System Context) is the Country Map. It shows the boundaries of the system (the city) and how it connects to other cities (external systems) and populations (users).
- Level 2 (Container) is the City Map. It identifies the major districts and infrastructure, such as the industrial park (database), the business district (API), and the residential area (web app).
- Level 3 (Component) is the Neighborhood Map. It zooms into a specific district to show individual buildings (components) and the roads connecting them.
- Level 4 (Code) is the Building Blueprint. It details the wiring, plumbing, and structural elements of a single building.
Complementary Views
While the four core levels cover static structure, complex enterprise systems may require additional context. The C4 model supports complementary views to fill these gaps:
- System Landscape Diagrams: Used in large enterprises to show how multiple software systems relate to one another across the organization.

- Dynamic Diagrams: Visualize runtime behavior and the flow of messages between elements to explain complex workflows.
- Deployment Diagrams: Map containers to infrastructure nodes (e.g., Kubernetes pods, virtual machines, or CDNs) to illustrate physical deployment environments.
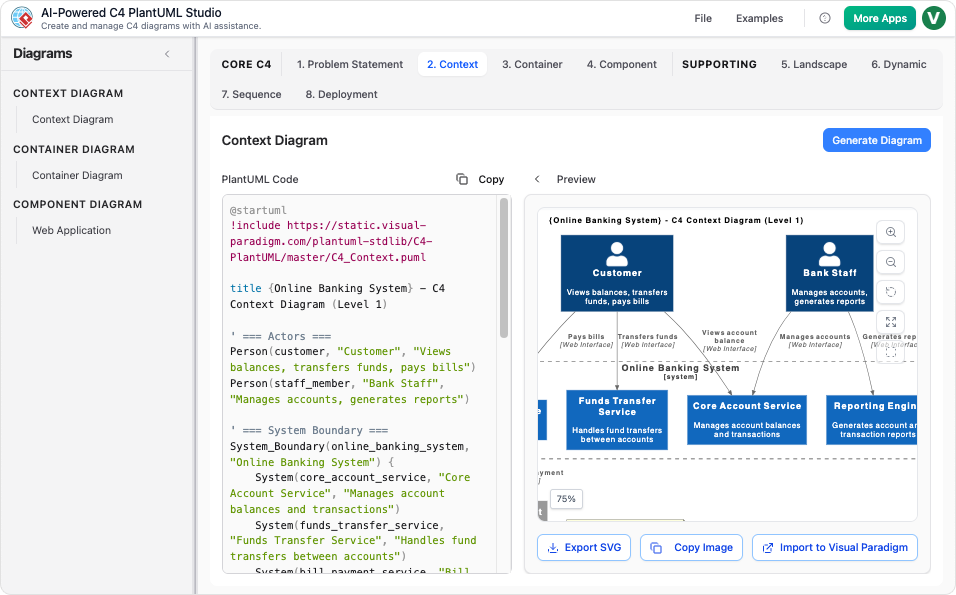
VP AI: Automating and Enhancing C4 Diagrams
Creating comprehensive C4 diagrams manually can be time-consuming and prone to inconsistency. Visual Paradigm AI transforms this workflow by leveraging artificial intelligence to automate the generation and refinement of architectural diagrams.
Visual Paradigm AI can assist in the following ways:
- Text-to-Diagram Generation: Users can input a natural language description of their system architecture (e.g., “A monolithic e-commerce Java application using PostgreSQL and a React frontend”), and the AI can generate a preliminary Level 1 or Level 2 diagram automatically.
- Architectural Consistency Checks: AI tools can analyze the relationships between different levels, ensuring that a container defined in Level 2 is accurately represented as a system boundary in Level 1.
- Smart Layouts: Complex architectures often result in messy connectors. VP AI algorithms can optimize diagram layouts for readability, reducing crossing lines and grouping related elements logically.
- Documentation Expansion: The AI can assist in generating descriptions for components and containers based on standard naming conventions, saving developers from writing repetitive documentation text.
By integrating AI into the C4 modeling process, teams can spend less time drawing boxes and lines and more time analyzing the architectural integrity and scalability of their solutions.
-
Ultimate Guide to C4 Model Visualization Using Visual Paradigm’s AI Tools: A comprehensive guide on leveraging Visual Paradigm’s AI-powered tools to automate and enhance C4 model visualization for faster, smarter software architecture design.
-
Leveraging Visual Paradigm’s AI C4 Studio for Streamlined Architecture Documentation: A detailed guide on using Visual Paradigm’s AI-enhanced C4 Studio to create clean, scalable, and maintainable software architecture documentation.
-
The Ultimate Guide to C4-PlantUML Studio: Revolutionizing Software Architecture Design – Visual Paradigm Blog: 2 weeks ago – Software architecture documentation is often a bottleneck—time-consuming, error-prone, and quickly outdated. The C4-PlantUML Studio, developed by Visual Paradigm, changes this by combining AI-driven automation, the C4 model’s clarity, and PlantUML’s flexibility into a single, powerful tool.
-
A Comprehensive Guide to Visual Paradigm’s AI-Powered C4 …: Dec 3, 2025 · Enter Visual Paradigm ’s AI-Powered C4 PlantUML Studio, released November 14, 2025 — a purpose-built tool that transforms natural language into correct, layered C4 diagrams. But how is it different from just asking ChatGPT or Claude to “draw a system diagram”? And can it really generate valid C4? Let’s unpack it all.
-
C4-PlantUML Studio | AI-Powered C4 Diagram Generator – Visual Paradigm: An AI-powered tool to automatically generate C4 software architecture diagrams from simple text descriptions.
-
Comprehensive Tutorial: Generating and Modifying C4 Component …: Dec 16, 2025 · This tutorial is based on the official Visual Paradigm product demo video, demonstrating how to use the AI-powered Chatbot to create and iteratively refine a C4 Component Diagram for a car park booking system. The C4 model (Context, Containers, Components, and Code) is a popular approach for visualizing software architecture, and the Component level focuses on the internal structure of a …
-
AI-Powered C4 Diagram Generator – Visual Paradigm AI: C4 & Supporting Diagrams The AI-Powered C4 Diagram Generator supports the four core levels of the C4 Model (Context, Container, Component, Deployment) plus essential supporting views to provide comprehensive architectural documentation. Core C4 Diagrams The Core C4 Diagrams are fundamental for documenting the static structure of your software system, detailing how it is broken down …
-
Visual Paradigm Full C4 Model Support Release: This release announcement details the integration of full C4 model support in Visual Paradigm, enabling users to create and manage architecture diagrams at multiple abstraction levels.
-
New: Full C4 Model Support Added to Visual Paradigm Desktop – ArchiMetric: 6 days ago · The C4 Model: A Comprehensive Guide to Visualizing Software Architecture with AI-Powered Tools …
-
Visual-paradigm: Our AI supports a wide range of diagrams across various domains, including UML, C4 models for software architecture, and strategic frameworks like SWOT and PESTLE analysis.
-
Visual Paradigm AI Suite: A Comprehensive Guide to Intelligent Modeling Tools – Cybermedian: 6 days ago – Strategic Frameworks: SWOT Analysis, PEST/PESTLE Analysis, Ansoff Matrix, and Blue Ocean Four Actions Framework. Systems Engineering: SysML Block Definition, Internal Block, and Requirement diagrams. Architecture: ArchiMate diagrams and C4 models. General Business: Organization Charts, Mind Maps, and PERT Charts. While the AI Chatbot is a cloud-based feature of VP Online, it is seamlessly integrated into the Visual Paradigm Desktop environment.
-
Visual-paradigm: Our AI supports a wide range of diagrams across various domains, including UML, C4 models for software architecture, and strategic frameworks like SWOT and PESTLE analysis.

