In the intricate landscape of Object-Oriented Analysis and Design (OOAD), the behavior of an object is often as critical as its structure. While class diagrams define what an object is, state diagrams define what an object does over time. Managing complex object lifecycles requires a rigorous approach to modeling transitions, ensuring that systems behave predictably under varied conditions. This guide explores the mechanics of state diagrams, focusing on how they bring clarity to dynamic systems where state changes dictate functionality.
🎯 Understanding Object Lifecycles
Every object within a software system exists for a specific duration, moving through various phases from creation to destruction. This journey is not always linear. Objects often transition back and forth between states based on internal logic or external events. Without a clear model, these transitions can become tangled, leading to bugs that are difficult to trace.
Consider a banking transaction system. A payment request does not simply move from “Pending” to “Completed.” It may enter states like “Processing,” “Failed,” “Refunded,” or “Disputed.” Each state carries specific permissions and behaviors. For instance, a “Refunded” payment cannot be processed again, while a “Pending” payment can be cancelled.
Key aspects of lifecycle management include:
- State Identification: Determining the distinct modes an object can exist in.
- Event Triggering: Identifying what causes a move from one state to another.
- Guard Conditions: Defining logical constraints that must be met before a transition occurs.
- Actions: Specifying operations performed upon entering, exiting, or completing a state.
By visualizing these elements, architects and developers gain a shared understanding of system behavior. This shared mental model reduces ambiguity and facilitates communication between stakeholders.
⚙️ Core Components of a State Diagram
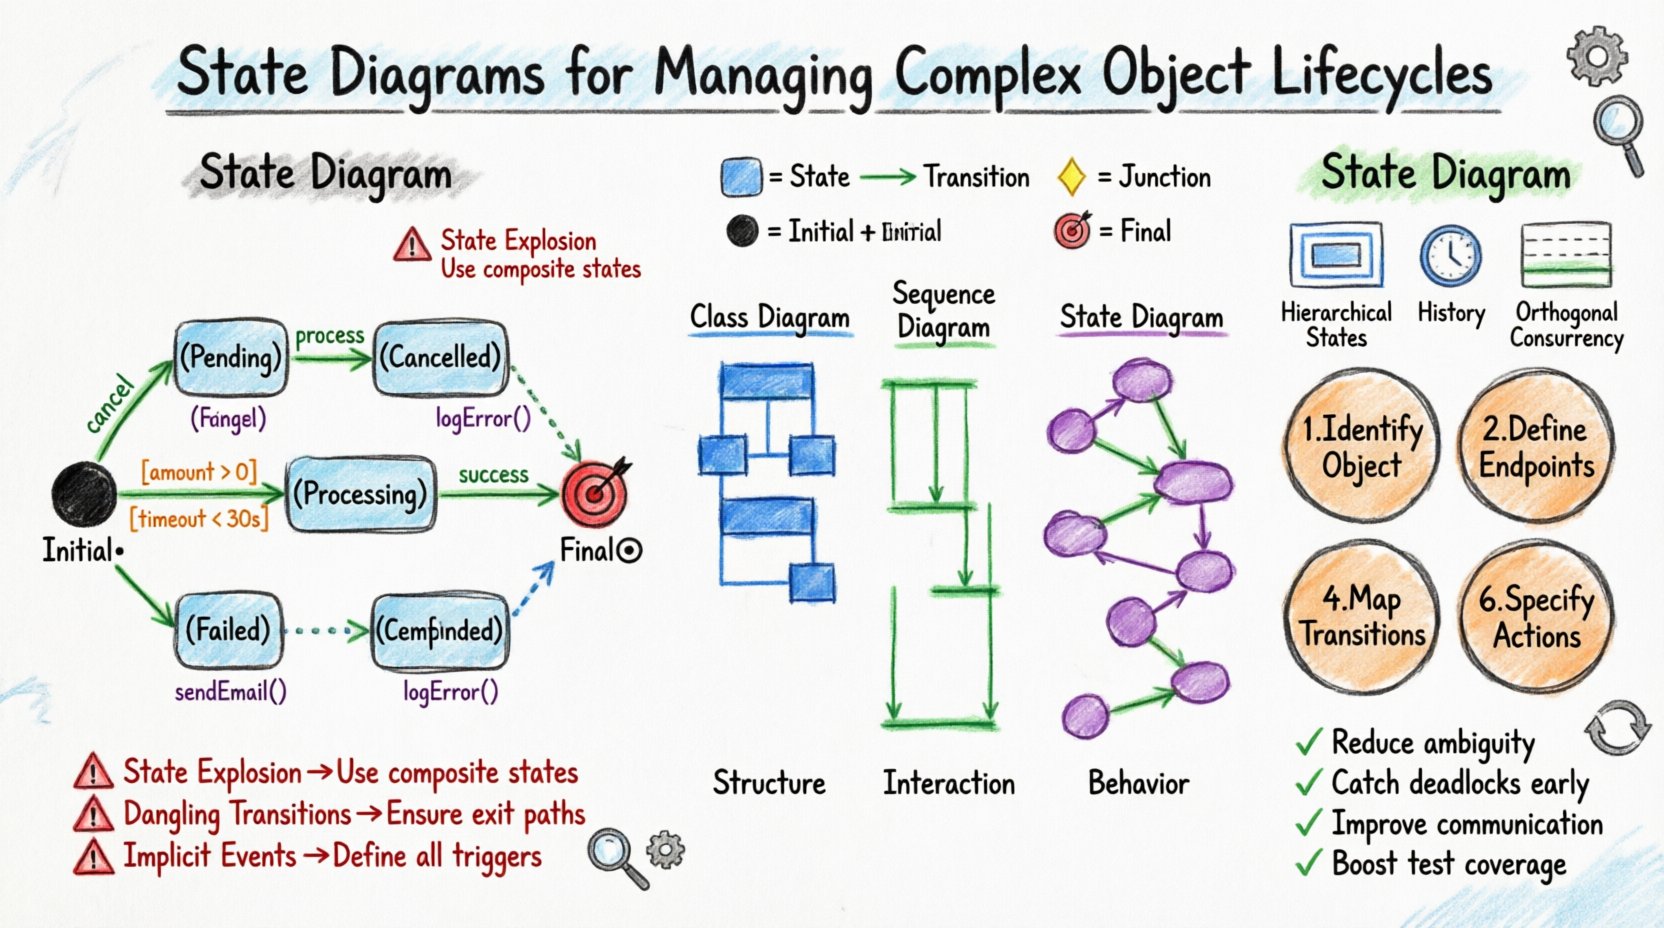
A state diagram is a visual representation of a Finite State Machine (FSM). It consists of specific symbols and connectors that convey the flow of control. Understanding these components is essential for constructing accurate models.
1. States
A state represents a condition or situation during the lifetime of an object where it satisfies some condition, performs some activity, or waits for some event. States are typically represented as rounded rectangles.
- Simple States: Basic conditions that cannot be decomposed further.
- Composite States: States that contain substates, allowing for hierarchical modeling.
- Initial State: The starting point of the lifecycle, usually a solid black circle.
- Final State: The termination point of the lifecycle, usually a solid black circle inside another circle.
2. Transitions
Transitions define the movement from one state to another. They are triggered by events and may involve actions or guard conditions.
- Event: Something that happens (e.g., user click, system timer, message arrival).
- Guard Condition: A Boolean expression that must evaluate to true for the transition to occur.
- Action: An operation executed during the transition (entry, exit, or during).
3. Junction Nodes
Junction nodes act as routing points where multiple transitions converge or diverge. They are used to manage complex logic without cluttering the diagram with redundant arrows.
📋 State vs. Class vs. Sequence
To understand where state diagrams fit in the broader design process, it helps to compare them with other modeling tools. The table below outlines the primary focus and use cases for each diagram type.
| Diagram Type | Primary Focus | Best Used For |
|---|---|---|
| Class Diagram | Structure and Attributes | Defining data models, relationships, and inheritance. |
| Sequence Diagram | Interaction Over Time | Visualizing message flow between objects for a specific scenario. |
| State Diagram | Internal Behavior | Modeling lifecycle logic, constraints, and state-dependent behavior. |
While class diagrams provide the skeleton, state diagrams provide the muscle and nervous system. They are particularly valuable when the logic of an object changes significantly based on its current status.
🧩 Designing for Complexity
Simple objects have a few states and straightforward transitions. Complex objects, however, require advanced modeling techniques to maintain clarity. When lifecycles become intricate, relying solely on flat state diagrams leads to spaghetti-like visuals that are impossible to maintain.
1. Hierarchical States (Composite States)
Complex objects often have sub-behaviors within a broader state. For example, an order object might be in a “Processing” state. Inside “Processing,” it could be “Validating,” “Shipping,” or “Packaging.” Using composite states allows you to group these sub-states under a parent state.
- Benefits: Reduces visual clutter and manages complexity.
- Entry/Exit Actions: You can define actions that run when entering the parent state (before substates) and when exiting (after substates).
2. History States
When an object returns to a composite state, it often needs to remember where it left off. A history state preserves the last active substate.
- Shallow History: Returns to the last active substate of the parent.
- Deep History: Returns to the last active substate of a substate within the hierarchy.
3. Orthogonal Regions (Concurrency)
Some objects manage multiple independent lifecycles simultaneously. For instance, a medical device might track “Patient Status” and “Device Battery” independently. Orthogonal regions allow you to split a state into multiple independent sub-regions that operate in parallel.
- Implementation: Visually represented by a dashed line dividing the composite state.
- Synchronization: Transitions may need to occur across regions to coordinate behavior.
🛠️ The Design Process
Creating a state diagram is not a random act of drawing. It follows a structured methodology to ensure accuracy and utility.
Step 1: Identify the Object
Select the specific object or entity that requires lifecycle management. Not every object needs a state diagram. Focus on entities with significant behavioral complexity.
Step 2: Define Initial and Final States
Map out the beginning and end points of the lifecycle. Ensure you account for scenarios where an object might be terminated prematurely or aborted.
Step 3: List All Possible States
Broadcast a list of all valid conditions the object can hold. Use domain experts to validate this list. Common pitfalls include missing states or conflating distinct states.
Step 4: Determine Transitions and Events
Draw arrows connecting the states. Label each arrow with the triggering event. Ask: “What causes this change?” and “Can this change happen from every state?”
Step 5: Add Guard Conditions
Refine the transitions by adding logic. If a transition only happens under specific data conditions, add a guard condition in brackets (e.g., [balance > 0]).
Step 6: Define Actions
Specify the side effects. What data is updated? What messages are sent? What logs are written? This links the diagram to the implementation logic.
⚠️ Common Pitfalls and Solutions
Even experienced designers encounter challenges when modeling lifecycles. Recognizing these traps early saves significant refactoring effort later.
- State Explosion: Creating too many states that branch out uncontrollably.
Solution: Use composite states to group similar behaviors and abstract common logic. - Dangling Transitions: Leaving states without outgoing transitions (deadlocks).
Solution: Review every state to ensure a path exists to the final state or a valid recovery state. - Implicit Events: Assuming events happen without defining them.
Solution: Explicitly list all external triggers and internal triggers. - Overlapping Logic: Having multiple transitions trigger the same action without distinction.
Solution: Consolidate actions where possible or use entry/exit actions within states.
🧪 Validation and Testing
A state diagram is a specification. It must be validated against the actual system behavior. Testing strategies should align with the states and transitions defined.
State Coverage
Ensure that test cases cover every state in the diagram. This verifies that the object can enter and remain in every defined condition.
Transition Coverage
Test every arrow connecting the states. Verify that the event triggers the correct transition and that guard conditions block invalid transitions.
Exception Handling
Model what happens when things go wrong. Add states for “Error” or “Retry” scenarios. A robust lifecycle diagram accounts for failures gracefully.
🔄 Implementation Patterns
Translating a state diagram into code requires a disciplined approach. The goal is to keep the logic decoupled from the object’s core data.
1. State Pattern
The State design pattern encapsulates behavior for each state into separate classes. The main object delegates behavior to the current state object. This keeps conditional logic (if/switch) out of the main class.
2. Switch-Case Logic
For simpler systems, a state variable combined with a switch-case structure is effective. While less flexible than the State Pattern, it is easier to maintain for linear flows.
3. Event Queue
Complex systems often process events asynchronously. Implementing an event queue ensures that transitions are handled in the order they occur, preventing race conditions.
📈 Maintenance and Evolution
Software requirements change. Object lifecycles are no exception. A well-documented state diagram serves as a living artifact that evolves with the system.
- Version Control: Treat state diagrams as code. Store them in version control systems to track changes over time.
- Impact Analysis: When adding a new state, check all incoming and outgoing transitions to ensure consistency.
- Refactoring: If a diagram becomes too dense, break composite states into separate entities or introduce new abstractions.
💡 Key Takeaways
State diagrams are a fundamental tool for managing complex object lifecycles in Object-Oriented Analysis and Design. They provide a clear, visual contract for how an object behaves over time.
By focusing on states, transitions, and events, teams can:
- Reduce ambiguity in system requirements.
- Identify deadlocks and unreachable states early.
- Facilitate communication between technical and non-technical stakeholders.
- Improve test coverage by mapping logic to visual paths.
Adopting this discipline does not eliminate complexity, but it makes it manageable. As systems grow, the need for structured behavioral modeling increases. Investing time in accurate state diagrams pays dividends in system reliability and maintainability.
Remember to keep diagrams up to date. An outdated diagram is worse than no diagram at all. Regular reviews ensure that the model remains a true reflection of the system’s actual behavior.