Designing complex software systems requires clear communication between team members. Visualizing how different parts of an application interact is essential for maintaining code quality and understanding system architecture. Among the various modeling techniques available, the UML Communication Diagram stands out for its ability to show object interactions in a compact, readable format. This guide provides a structured approach to creating your first diagram efficiently, focusing on clarity and precision without unnecessary complexity.
What Exactly is a Communication Diagram? 🤔
A UML Communication Diagram is a type of interaction diagram. It describes the interactions between objects in terms of sequenced messages. Unlike other interaction diagrams that focus heavily on time sequences, this diagram emphasizes the structural organization of the objects involved. It combines the visual layout of an object diagram with the interaction information of a sequence diagram.
When you draw this diagram, you are mapping out the relationships between specific instances of classes within a system. The primary goal is to illustrate how a single message flows through the system, triggering a chain of events. This helps developers identify potential bottlenecks, understand dependency chains, and verify that the logic flow matches the intended design specifications.
Key characteristics include:
- Structural Focus: It highlights the static structure (objects) alongside dynamic behavior (messages).
- Message Sequencing: Messages are numbered to indicate the order of execution.
- Compactness: It is often more compact than a sequence diagram, making it easier to view at a glance.
- Navigation: It shows the navigation paths between objects, which is crucial for understanding how data moves.
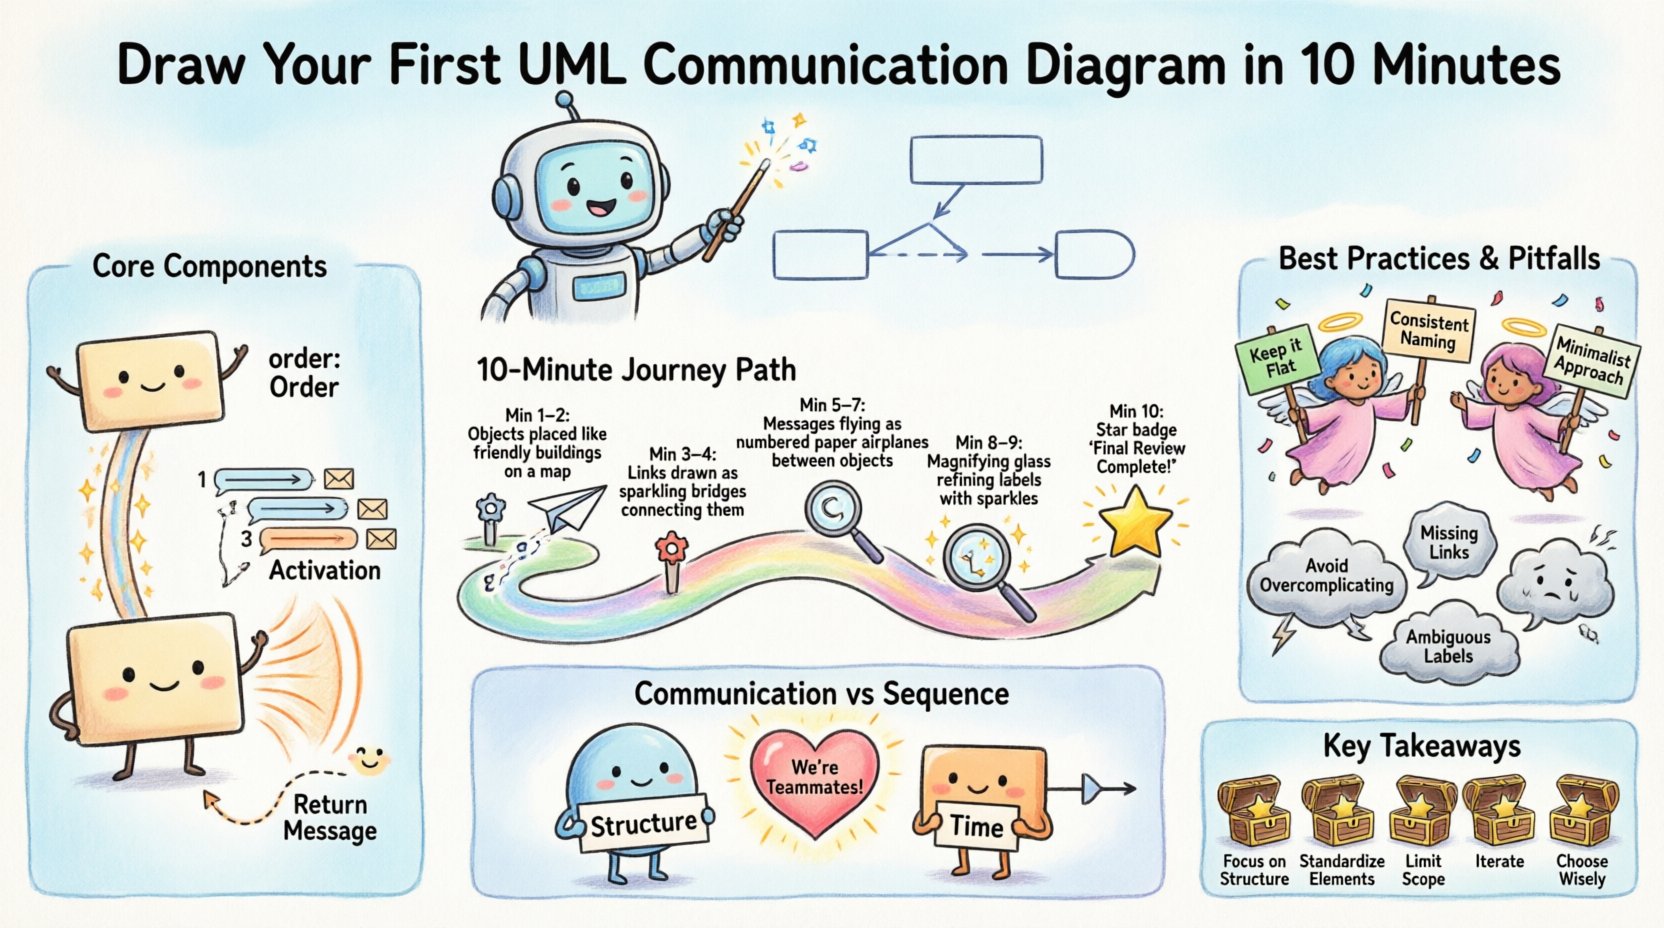
Core Components Breakdown 🧩
Before starting, it is vital to understand the building blocks. Every valid diagram relies on a specific set of standard elements. Misusing these can lead to confusion for anyone reviewing your work.
| Component | Description | Visual Representation |
|---|---|---|
| Object | An instance of a class participating in the interaction. | Rectangle with class name and instance name (e.g., order: Order) |
| Link | A connection between two objects, representing a relationship. | Solid line connecting the objects |
| Message | A signal sent from one object to another to trigger an action. | Arrow with a label and sequence number |
| Activation | A period during which an object is performing an action. | Thin rectangle on the object or link |
| Return Message | The response sent back to the caller. | Dashed arrow pointing back to the sender |
Understanding these elements ensures that your diagram remains standard-compliant and readable. Each component serves a specific purpose in conveying the state of the system at a given moment. For instance, the activation bar indicates when an object is busy processing a request, which is critical for understanding concurrency and processing load.
Preparing for the Session 📝
Efficiency begins before you touch the drawing canvas. Preparation ensures that the 10-minute window is sufficient to create a high-quality output. Rushing into drawing without a plan often leads to rework.
1. Define the Scope 🎯
Decide exactly which functionality you are modeling. Are you looking at a user login flow? A payment processing transaction? A data retrieval operation? Narrowing the scope prevents the diagram from becoming cluttered with irrelevant interactions.
2. Identify Key Objects 🏷️
List the primary objects involved in this specific scenario. Usually, this includes a Controller, a Service, a Repository, and an Entity. Keep the list short. If you find yourself listing more than five or six objects, you may be trying to model too much for a single view.
3. Determine the Trigger 🔔
What starts the interaction? Is it a user clicking a button? Is it an external API call? Is it a scheduled task? Identifying the trigger helps you place the first object correctly in the visual hierarchy.
4. Gather Requirements 📄
Have your technical specifications or user stories ready. You will need to know what parameters are passed between objects and what data is returned. This ensures the message labels are accurate.
The 10-Minute Execution Plan 🚀
With preparation complete, follow this step-by-step workflow to draw your diagram within the allocated time.
Minute 1-2: Place the Objects 🖼️
Start by placing the identified objects on the canvas. Arrange them logically. If Object A calls Object B, place them close to each other to minimize the length of the connecting lines. Avoid crossing lines where possible, as this creates visual noise. Use the structural relationships you know to position them.
- Use the trigger object as the starting point.
- Group related objects together.
- Ensure enough white space exists between objects for message labels.
Minute 3-4: Draw the Links 🔗
Connect the objects with lines that represent their relationships. These lines indicate that the objects are aware of each other and can communicate. If Object A needs to call a method on Object B, there must be a link between them.
- Ensure all necessary connections exist before adding messages.
- Do not draw links that are not required for the current interaction.
- Keep lines straight or orthogonal; avoid jagged curves unless necessary.
Minute 5-7: Add the Messages ✉️
This is the core of the diagram. Draw arrows between objects to show the flow of information. Number the messages sequentially (1, 2, 3) to indicate the order of execution. Label each message with the method name or action being performed.
- Use solid arrows for synchronous calls.
- Use dashed arrows for return values.
- Ensure the direction of the arrow matches the flow of control.
- Include parameters in the label if they are critical (e.g., 1. getItems(id: 123)).
Minute 8-9: Refine and Label 🔍
Review the diagram for clarity. Are all labels readable? Is the sequence logical? Check for any missing links. Ensure that the numbers correspond to the actual flow of execution. Add activation bars if an object needs to perform multiple steps internally before responding.
Minute 10: Final Review ✅
Take a moment to step back. Does this diagram accurately reflect the system behavior described in the requirements? If yes, the task is complete. If not, make quick adjustments to the labels or positions.
Best Practices for Clear Diagrams 🛡️
Creating a diagram is one thing; creating a useful one is another. Adhering to established best practices ensures that your work remains valuable over time.
- Keep it Flat: Avoid creating overly deep hierarchies of messages. If the flow requires too many steps, consider breaking the scenario into smaller diagrams.
- Consistent Naming: Use the same naming convention for objects and methods throughout the diagram. This reduces cognitive load for the reader.
- Minimalist Approach: Do not include every possible interaction. Focus on the happy path and the critical error handling flows.
- Grouping: If objects belong to the same subsystem, consider visually grouping them to show logical boundaries.
- Orientation: Try to orient messages from left to right or top to bottom. This aligns with natural reading patterns.
- Color Usage: While standard diagrams are black and white, some tools allow color coding. Use color sparingly to highlight critical paths or exceptions, not for decoration.
Common Pitfalls to Sidestep ⚠️
Even experienced practitioners can fall into traps that reduce the utility of their diagrams. Being aware of these common mistakes helps you maintain high standards.
- Overcomplicating: Trying to show every single method call in a large system. This results in a spaghetti diagram that is impossible to read. Focus on the high-level interaction.
- Missing Links: Drawing a message between two objects that have no link between them. This violates the structural integrity of the design.
- Incorrect Sequencing: Numbering messages out of order. This confuses the reader about the flow of execution.
- Ambiguous Labels: Using generic names like Process Data instead of specific method names like validateUser().
- Ignoring Return Values: Forgetting to show the response from a method call, which hides the data flow.
- Too Many Objects: Including objects that do not participate in the specific interaction being modeled.
Communication vs Sequence Diagrams 🔄
A common question arises when choosing between diagram types. How does a Communication Diagram differ from a Sequence Diagram? Both show interactions, but they emphasize different aspects.
A Sequence Diagram prioritizes time. It places objects on a vertical axis and messages on a horizontal axis, creating a clear timeline. It is excellent for showing detailed timing and concurrency. However, it can become very wide and cluttered when many objects are involved.
A Communication Diagram prioritizes structure. It places objects based on their relationships. It is better for showing the topology of the system and the navigation paths. If you need to understand how objects are connected, the Communication Diagram is often superior. If you need to understand exactly when things happen, the Sequence Diagram is better.
For quick start scenarios where the structural relationship is key, the Communication Diagram is often the preferred choice due to its compact nature.
Keeping Your Diagrams Alive 🔄
A diagram is not a static artifact. It is a living document that should evolve with the codebase. Once you have created your first diagram, consider the following maintenance strategies.
- Version Control: Treat your diagrams like code. Store them in your version control system to track changes over time.
- Review Cycles: Include diagram reviews in your sprint planning or design review meetings. Ensure the visual matches the implementation.
- Update on Change: If a method signature changes, update the diagram immediately. Do not let it drift from reality.
- Documentation Link: Link the diagram to the relevant user stories or technical specifications. This provides context for future developers.
Next Steps for Your Workflow 📈
Mastering the creation of these diagrams is a skill that improves with practice. Start with simple interactions and gradually increase the complexity. As you become more comfortable, you will find that these visualizations help you spot design flaws before you write a single line of code.
Integrating this practice into your development workflow can significantly improve team alignment. When everyone looks at the same structural representation of the system, misunderstandings decrease, and collaboration increases. Use the techniques outlined here to build a foundation for better system design.
Remember that the goal is clarity. If a diagram is confusing to you, it will be confusing to your teammates. Simplify. Clarify. Communicate.
Summary of Key Takeaways 📌
- Focus on Structure: Emphasize object relationships alongside message flow.
- Standardize Elements: Use standard UML notation for objects, links, and messages.
- Limit Scope: Model one specific scenario per diagram to maintain readability.
- Iterate: Update diagrams as the system evolves to keep documentation accurate.
- Choose Wisely: Use this diagram type when structural context is more important than precise timing.
By following this guide, you can effectively produce professional-grade UML Communication Diagrams that enhance understanding and streamline development processes. The investment of time in creating these visuals pays dividends in reduced bugs and clearer team communication.