In the fast-paced world of software development, clarity is currency. Teams move quickly, sprints are tight, and the pressure to deliver functional value is constant. Amidst this velocity, architectural artifacts often become battlegrounds between rigor and agility. One specific artifact that frequently sparks debate is the Communication Diagram. Often overshadowed by its cousin, the Sequence Diagram, the Communication Diagram holds unique value—but it is not a universal fix for every communication breakdown.
This guide cuts through the noise. We are not here to sell you on a new methodology or claim this tool will fix your team’s culture overnight. Instead, we are examining the practical utility of these diagrams within Agile frameworks. We will dissect what they actually solve, where they fall short, and how to integrate them without creating bureaucratic overhead. 🧐
Understanding the Communication Diagram 📐
A Communication Diagram is a type of interaction diagram within the Unified Modeling Language (UML). It focuses on the structural organization of objects and how they interact to achieve a specific task. Unlike the Sequence Diagram, which emphasizes the chronological order of messages, the Communication Diagram emphasizes the object relationships and the links between them.
Think of it as a map of connections rather than a timeline of events. It displays objects as nodes and the links between them as lines. Messages are numbered to show the sequence, but the visual layout allows you to see the topology of the system at a glance.
The Agile Landscape: Why Clarity Matters 🚀
Agile methodologies prioritize individuals and interactions over processes and tools. However, this does not mean documentation is obsolete. It means documentation must be valuable. In a distributed team or a complex microservices architecture, assumptions can lead to costly refactoring later.
Communication diagrams serve a specific niche in this environment:
- Visualizing Complex Logic: When simple flowcharts fail to capture the complexity of object interactions.
- Onboarding New Developers: Providing a high-level view of how components talk to one another.
- Refactoring Planning: Understanding dependencies before changing a core module.
However, relying on them as the primary source of truth can lead to stagnation. The key is knowing when to deploy this tool and when to rely on code reviews or user stories.
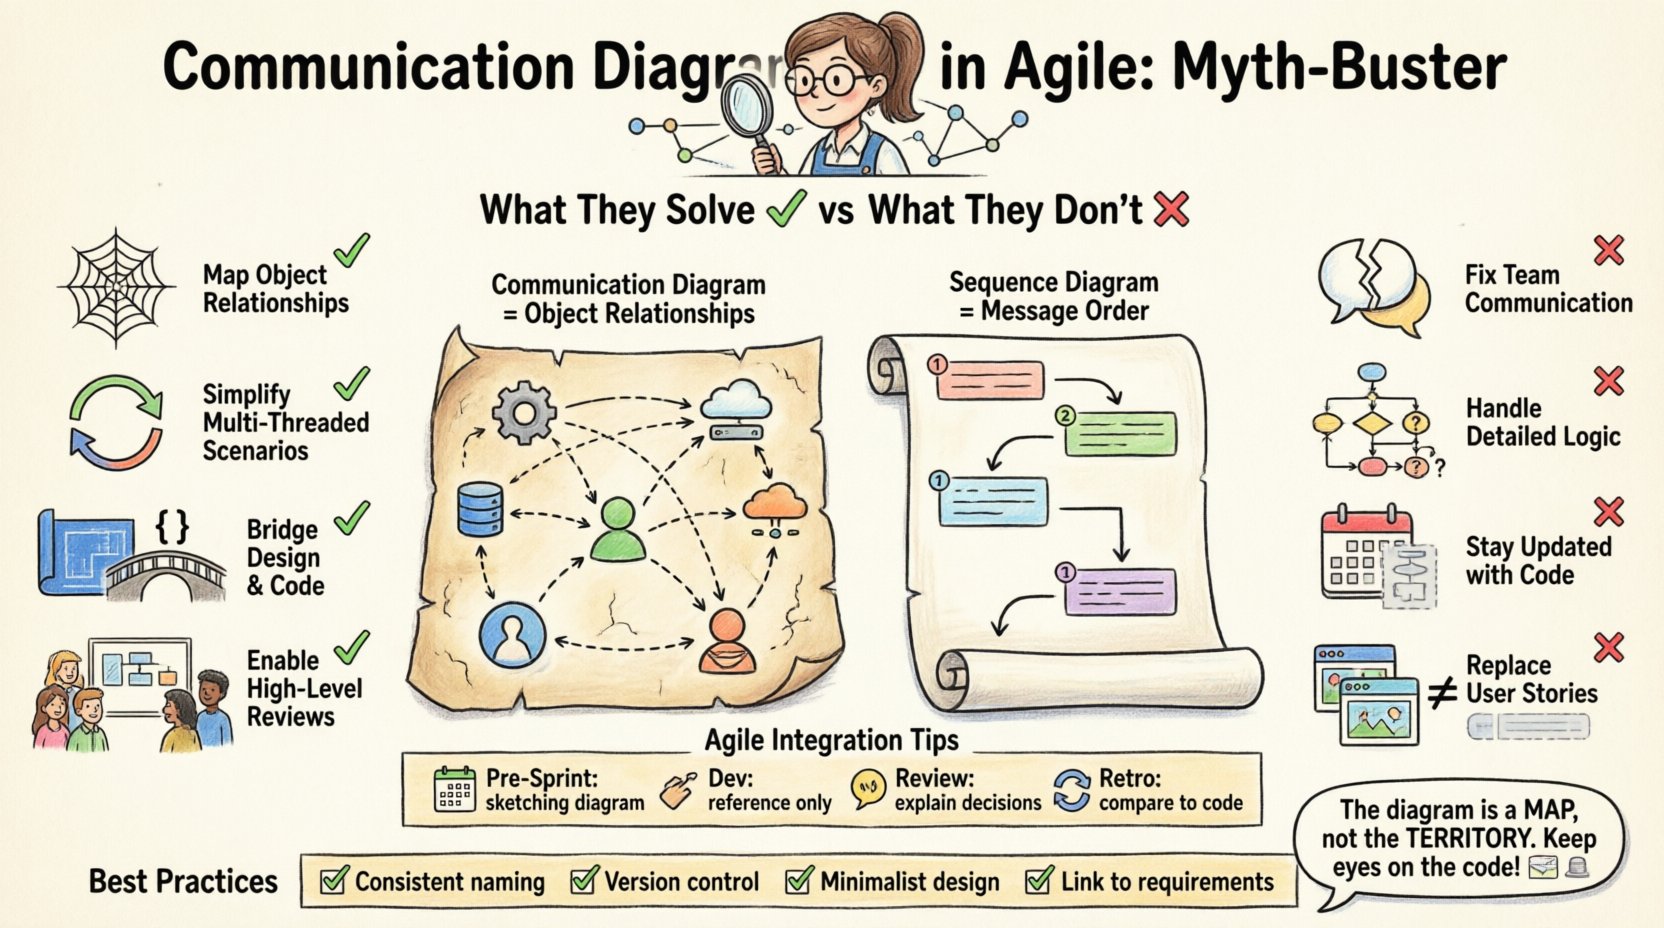
What These Diagrams Actually Solve ✅
To understand the utility, we must look at the specific problems these diagrams address. They are not magic; they are representations of logic. Here is where they add genuine value.
1. Mapping Object Relationships 🕸️
Sequence diagrams can become cluttered when showing the same object interacting with ten different others. A Communication Diagram flattens this view. It shows the structural link clearly. This is vital for:
- Identifying tight coupling between modules.
- Visualizing the hierarchy of data ownership.
- Understanding which objects hold the state for a specific feature.
2. Simplifying Multi-Threaded Scenarios 🔄
In systems where concurrency is a factor, the flow of messages can be complex. While Sequence diagrams show time, Communication diagrams show reachability. This helps developers understand if Object A needs to talk to Object B directly, or if it must go through an intermediary. This structural insight is crucial for performance tuning.
3. Bridging the Gap Between Design and Code 🧱
During the planning phase, teams often struggle to translate user stories into class structures. A Communication Diagram bridges this gap. It forces the team to identify the actors (objects) involved in a feature before writing the first line of code. This reduces the likelihood of discovering architectural flaws during integration testing.
4. Facilitating High-Level Reviews 🧐
Not every stakeholder needs to see a detailed Sequence Diagram with timestamps and lifelines. A Communication Diagram provides a cleaner, more abstract view suitable for:
- Stakeholder walkthroughs.
- Architecture review boards.
- Project status meetings where high-level flow is the focus.
What They Fail to Address ❌
Myth-busting requires admitting where the tool fails. There is a tendency to treat diagrams as a substitute for communication rather than an aid. Here is what Communication Diagrams do not solve.
1. Real-Time Collaboration Issues 🗣️
Creating a diagram does not fix a team that cannot talk. If your sprint retrospectives are plagued by misunderstandings, a static image will not resolve the underlying cultural or process friction. Diagrams are artifacts; they are not conversations.
2. Detailed Logic and Edge Cases ⚙️
Communication Diagrams show the path, but rarely the logic. They do not explain why a message is sent or what happens if a condition fails. They lack the depth to handle error handling, exception flows, or complex conditional branching. Relying on them for logic specifications leads to incomplete implementation.
3. Code Accuracy Over Time 📉
Agile projects evolve rapidly. Code changes faster than diagrams can be updated. If a Communication Diagram is not part of the Definition of Done, it becomes outdated immediately after the first sprint. It creates a false sense of documentation completeness. It does not solve the problem of technical debt accumulation.
4. Replacing User Stories 📝
Some teams attempt to use diagrams to replace acceptance criteria. This is a fundamental error. A diagram shows the system structure; it does not capture user intent. A user story describes the value; a diagram describes the mechanism. They are complementary, not interchangeable.
Communication vs. Sequence: A Side-by-Side View 📊
Confusion often arises between Communication Diagrams and Sequence Diagrams. Both are interaction diagrams, but they serve different cognitive purposes. Understanding the distinction helps decide which tool to use for a specific task.
| Feature | Communication Diagram | Sequence Diagram |
|---|---|---|
| Focus | Object relationships and links. | Time and message order. |
| Layout | Flexible, network-like structure. | Vertical timeline with lifelines. |
| Readability | Better for complex object networks. | Better for linear, time-based flows. |
| Complexity | Can get messy with many loops. | Can get long and narrow. |
| Best Use Case | System topology and interaction mapping. | Transaction flows and timing constraints. |
Integrating Diagrams into Sprint Cycles 🔄
How do you bring these diagrams into an Agile workflow without slowing down? The goal is to keep the artifact lightweight and relevant. Here is a practical approach to integrating them into your sprint cadence.
1. Pre-Sprint Planning 🗓️
Use the diagram during the refinement phase. When a complex feature is identified, draft a rough Communication Diagram to identify the objects involved. This helps in splitting stories. If the diagram shows too many dependencies, the story might be too large for a single sprint.
2. Development Phase 🛠️
Keep the diagram accessible but not mandatory for every commit. It serves as a reference for developers who need to understand the context of their work. If the architecture changes significantly, the diagram should be updated. If the change is minor, it can be left for a future refactoring task.
3. Sprint Review 📢
Do not present the diagram as a final artifact unless it is part of the system documentation. Use it to explain the why behind a decision if questioned by stakeholders. If the feature works, the diagram is a retrospective tool, not a deliverable.
4. Retrospective 🔄
Review the diagram against the actual code. Did the implementation match the design? If not, why? This analysis helps refine the estimation process for future sprints. It highlights where assumptions were wrong.
Common Pitfalls and How to Avoid Them ⚠️
Even with good intentions, teams often misuse these diagrams. Recognizing these pitfalls early saves significant time and effort.
Pitfall 1: Over-Engineering 🏗️
Teams sometimes create diagrams that are too detailed, trying to capture every edge case. This defeats the purpose of Agile. Solution: Limit the scope. Focus on the critical path. Ignore minor error handling in the diagram; keep that for the code comments.
Pitfall 2: The “Draw Once, Forget” Syndrome 📄
A diagram is created during a workshop and then never touched again. It becomes a relic. Solution: Treat the diagram as living documentation. Link it to the project management tool or the code repository. Update it only when the architecture changes.
Pitfall 3: Confusing Abstraction Levels 📉
A common mistake is mixing high-level system objects with low-level database fields in the same diagram. This creates confusion. Solution: Stick to one level of abstraction per diagram. If you are showing object interactions, do not include database schemas unless necessary.
Pitfall 4: Assuming Everyone Can Read It 🧐
Not all team members understand UML notation. A diagram that requires a legend to be understood is a failed diagram. Solution: Use standard symbols. Keep labels clear. If a stakeholder cannot understand it in 30 seconds, simplify it.
Best Practices for Documentation Hygiene 🧹
To maintain the value of these artifacts, you must enforce standards. This does not mean rigid bureaucracy; it means consistency.
- Consistent Naming: Use domain language for object names. Avoid generic terms like “Object1” or “Handler” unless necessary.
- Version Control: Store diagrams alongside the code in the repository. This ensures they are versioned with the application.
- Minimalist Approach: Use fewer elements to convey more meaning. White space is a design element.
- Tool Agnosticism: Do not rely on proprietary formats. Ensure diagrams can be exported or viewed without specific software licenses.
- Link to Requirements: If a diagram exists to support a specific requirement, link them together. This provides traceability.
The Human Element: Collaboration Over Artifacts 👥
Ultimately, the most effective communication in Agile comes from face-to-face interaction. A diagram is a tool to support that interaction, not replace it.
When a team is stuck, do not ask them to draw a diagram. Ask them to whiteboard. The act of drawing is secondary to the act of discussing. The diagram should be the output of a discussion, not the input for a silent task.
Consider the role of the diagram in your specific team culture. If your team is highly collaborative, you may find you need fewer formal diagrams. If your team is distributed across time zones, these diagrams become more critical for asynchronous understanding.
When to Skip the Diagram Entirely 🚫
There are times when a diagram adds more noise than signal. Recognizing these moments is a sign of seniority and efficiency.
- Simple CRUD Operations: If a feature simply creates, reads, updates, and deletes data without complex logic, a diagram is redundant.
- Well-Known Patterns: If you are using a standard design pattern (like Observer or Factory) that the whole team understands, a diagram adds little value.
- Short-Lived Features: For a one-off script or a quick prototype, the cost of creating and maintaining a diagram outweighs the benefit.
- Existing Documentation: If a similar feature already has a diagram in the knowledge base, reuse it rather than recreating it.
Final Thoughts on Architectural Clarity 🧠
The debate over Communication Diagrams in Agile projects often stems from a misunderstanding of their purpose. They are not meant to replace code, nor are they meant to serve as a permanent contract between teams. They are a momentary snapshot of system intent.
When used correctly, they reduce cognitive load during complex reviews. When used incorrectly, they become a maintenance burden that distracts from the actual work. The goal is not to produce perfect diagrams; it is to produce clear understanding.
By focusing on the structural relationships and avoiding the trap of over-documentation, teams can leverage these diagrams to navigate complexity without losing agility. The diagram is a map, not the territory. Keep your eyes on the code, and use the map only when the terrain gets difficult. 🗺️
Remember, the best documentation is often the code itself, supported by diagrams that clarify the difficult parts. Balance the two, and your Agile project will remain both flexible and robust.