Building a real-time chat system involves intricate interactions between multiple components. Clients, servers, databases, and notification services must coordinate seamlessly. A Communication Diagram provides a clear visual representation of these interactions. This guide explores how to model such systems effectively. We will focus on object relationships and message flows without relying on timing details. This approach highlights structural dependencies and collaboration patterns.
Understanding Communication Diagrams in System Design 📐
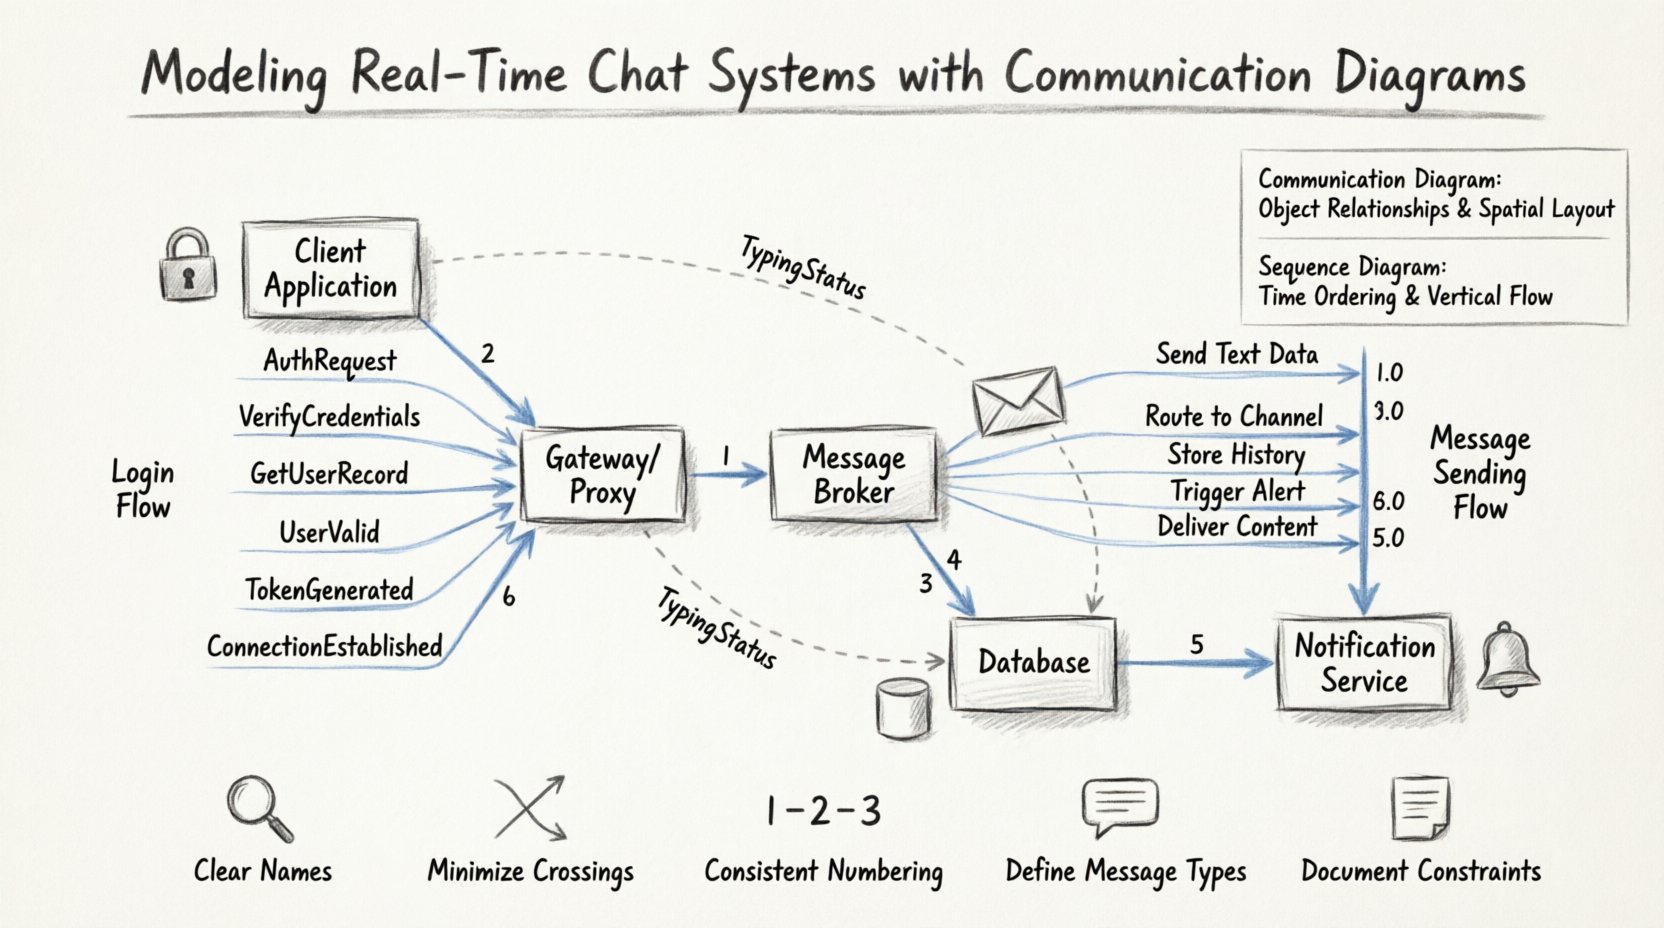
A Communication Diagram, formerly known as a Collaboration Diagram, is a type of Unified Modeling Language (UML) diagram. It emphasizes the structural organization of objects and the messages exchanged between them. Unlike Sequence Diagrams, which focus on time ordering, Communication Diagrams prioritize the spatial arrangement of objects. This distinction is vital when analyzing complex systems like chat applications.
Key characteristics include:
- Objects represented as nodes: Each box represents a specific component or class.
- Links as connections: Lines connect objects to show relationships.
- Messages as arrows: Arrows indicate data or control flow direction.
- Message sequencing: Numbers on arrows define the order of execution.
When modeling a chat system, these diagrams help developers visualize how a message travels from a sender to a receiver. They reveal hidden dependencies and potential bottlenecks in the architecture.
Defining the Chat System Architecture 🏗️
Before drawing the diagram, we must define the core components. A standard real-time chat system typically consists of the following elements:
- Client Application: The interface used by the end user to send and receive messages.
- Gateway/Proxy: Handles incoming connections and manages WebSocket or HTTP streams.
- Message Broker: Facilitates the routing of messages between different users.
- Database: Stores message history, user profiles, and metadata.
- Notification Service: Triggers alerts for new messages or status changes.
Understanding these entities allows us to map their interactions accurately. Each component plays a distinct role in the lifecycle of a chat message.
Component Interaction Overview
| Component | Primary Responsibility | Interaction Type |
|---|---|---|
| Client | User Input and Display | Outbound Requests |
| Gateway | Connection Management | Protocol Translation |
| Broker | Message Routing | Internal Switching |
| Database | Persistence | Read/Write Operations |
| Notification | Alerting | Push Signals |
Modeling the Login and Connection Flow 🔑
The first interaction in a chat system is authentication and connection establishment. A user must verify their identity before accessing the network. This process involves multiple steps that must be modeled precisely.
Consider the following sequence of events:
- The Client sends credentials to the Gateway.
- The Gateway forwards the request to the Authentication Service.
- The Service queries the Database for user verification.
- Upon success, the Gateway establishes a persistent connection.
- The Notification Service is notified of the new session.
In a Communication Diagram, this flow is represented by numbered arrows connecting the relevant objects. The numbering ensures that the logical order is preserved, even if the layout is not strictly top-to-bottom.
Diagram Details for Login Flow
- Link 1: Client to Gateway. Message:
AuthRequest. - Link 2: Gateway to Auth Service. Message:
VerifyCredentials. - Link 3: Auth Service to Database. Message:
GetUserRecord. - Link 4: Database to Auth Service. Message:
UserValid. - Link 5: Auth Service to Gateway. Message:
TokenGenerated. - Link 6: Gateway to Client. Message:
ConnectionEstablished.
This structure ensures that no component acts without authorization. It also highlights where data flows from storage to the active session.
Modeling the Message Sending Flow ✉️
The core functionality of a chat system is sending messages. This process is more complex than login because it involves storage, delivery, and notification. We must model the path a message takes from origin to destination.
Step-by-Step Interaction Analysis
When a user sends a message, the system performs several actions in rapid succession. The Communication Diagram captures these actions as messages between objects.
- Step 1: Input Validation. The Client formats the data and sends it to the Gateway.
- Step 2: Routing. The Gateway identifies the recipient and forwards the payload to the Message Broker.
- Step 3: Persistence. The Broker instructs the Database to save the message history.
- Step 4: Delivery. The Broker pushes the message to the Recipient’s active connection.
- Step 5: Acknowledgment. The Recipient confirms receipt to the Client.
- Step 6: Notification. The Notification Service alerts the Recipient if they are offline.
Using a Communication Diagram for this flow allows the team to see the parallel nature of operations. For instance, the Database save and the Notification trigger can happen concurrently. This visual cue helps in optimizing performance.
Key Message Types
| Message ID | Sender Object | Receiver Object | Purpose |
|---|---|---|---|
| 1.0 | User Interface | API Gateway | Send Text Data |
| 2.0 | API Gateway | Message Broker | Route to Channel |
| 3.0 | Message Broker | Database | Store History |
| 4.0 | Message Broker | Notification Engine | Trigger Alert |
| 5.0 | Message Broker | Recipient Client | Deliver Content |
Notice how the diagram separates concerns. The Gateway handles transport, the Broker handles logic, and the Database handles storage. This separation is crucial for maintainability.
Handling Asynchronous Messages and Concurrency ⏱️
Real-time systems rely heavily on asynchronous communication. WebSockets allow for bidirectional data flow without constant polling. Modeling these interactions requires careful attention to message states.
In a Communication Diagram, asynchronous messages are often depicted with specific arrow styles. They indicate that the sender does not wait for an immediate response. This is common in chat systems where typing indicators or read receipts are sent.
Typing Indicator Flow
When a user starts typing, the system should inform the recipient immediately. This does not require database storage. It is a transient state.
- The Client detects a keystroke event.
- The Client sends a
TypingStatusmessage to the Gateway. - The Gateway forwards this to the Broker.
- The Broker relays the status to the Recipient’s client.
This flow is distinct from the message sending flow. It requires lower latency and does not involve persistence. The Communication Diagram helps distinguish these two paths clearly.
Concurrency Considerations
- Multiple Sessions: A user may be logged in on multiple devices. The diagram must show how the Broker handles updates across sessions.
- Conflict Resolution: If two users edit a message simultaneously, the system must decide which version to keep. This logic belongs to the Broker.
- Queue Management: If the Broker is overwhelmed, messages may queue. The diagram should show error paths for dropped packets.
Error Handling and Edge Cases 🚨
A robust system must handle failures gracefully. Communication Diagrams are excellent for mapping error scenarios. These diagrams show what happens when a component fails or a connection drops.
Scenario: Network Failure
If the Client loses connection while sending a message, the system must retry or queue the data. The diagram should include a path for RetryRequest or QueueMessage.
- Condition: Gateway receives message but cannot reach Broker.
- Action: Gateway returns error code to Client.
- Recovery: Client displays “Offline” status and queues local message.
- Resumption: When connection restores, Client sends queued messages.
Scenario: Invalid User ID
If a user attempts to message a non-existent recipient, the system must validate the target. The diagram should show a validation step before the message reaches the Broker.
- Check: Database verifies User ID exists.
- Result: If false, return
UserNotFounderror. - UI Update: Client shows error notification to sender.
By modeling these paths, developers can ensure that error handling is built into the architecture from the start.
Comparison with Sequence Diagrams 🔄
While Sequence Diagrams are popular, Communication Diagrams offer specific advantages for chat systems.
| Feature | Communication Diagram | Sequence Diagram |
|---|---|---|
| Focus | Object Relationships | Time Ordering |
| Layout | Flexible Spatial | Strict Vertical |
| Complexity | Good for Many Links | Good for Deep Nesting |
| Readability | Visualizing Connections | Visualizing Timing |
For a chat system with many interconnected services, the Communication Diagram reduces visual clutter. It allows the team to see the entire network topology at a glance.
Best Practices for Modeling Chat Systems 🛠️
To create effective diagrams, follow these guidelines.
1. Use Clear Object Names
Avoid generic names like Object1. Use descriptive names such as UserClient or MessageStore. This makes the diagram self-explanatory.
2. Minimize Crossing Lines
Arrange objects to reduce line intersections. If lines cross, use routing bends or labels to clarify the connection. Clarity is paramount for team understanding.
3. Number Messages Consistently
Ensure message numbers reflect the logical execution order. Use decimal notation (1.0, 1.1) for parallel processes to show they happen simultaneously.
4. Define Message Types
Clearly label whether messages are synchronous or asynchronous. Use distinct arrow styles or labels to indicate data types like JSON or binary streams.
5. Document Constraints
Add notes to the diagram regarding performance limits. For example, indicate if a specific link has a timeout threshold or rate limit.
Scaling and Maintenance 📈
As the chat system grows, the Communication Diagram must evolve. Adding new features like file sharing or voice calls changes the interaction map.
- File Sharing: Introduces a new object for the File Storage Service. The diagram must show the upload and download paths.
- Voice Calls: Introduces a Media Server. The diagram needs to show signaling and media streams separately.
- Encryption: If end-to-end encryption is added, the diagram should show where keys are exchanged and where data is decrypted.
Maintaining the diagram is part of the development lifecycle. When code changes, the diagram should be updated to reflect the new reality. This ensures documentation stays accurate.
Conclusion on System Modeling 🎯
Modeling real-time chat systems requires a clear understanding of component interactions. Communication Diagrams provide a robust way to visualize these relationships. They highlight dependencies, message flows, and potential failure points.
By following the steps outlined in this guide, teams can design architectures that are scalable and reliable. The focus remains on the structural integrity of the system rather than just the timing of events. This approach leads to better communication among developers and more stable software.
Remember that diagrams are living documents. They should be reviewed regularly as the system evolves. Keeping them up to date ensures that the technical knowledge remains accessible to all team members.