Now Reading: Mastering UML State Diagrams: A Step-by-Step Guide
-
01
Mastering UML State Diagrams: A Step-by-Step Guide


Mastering UML State Diagrams: A Step-by-Step Guide
In the complex landscape of software engineering and system design, effective visualization is key to understanding dynamic behaviors. UML (Unified Modeling Language) diagrams serve as powerful tools to represent these systems, with the UML State Diagram—often referred to as a State Machine Diagram—standing out for its specific ability to model how objects or systems transition through various states based on events. Whether you are designing the logic for a vending machine, a secure user authentication flow, or an intricate IoT device, state diagrams provide the clarity needed to understand how entities evolve over time.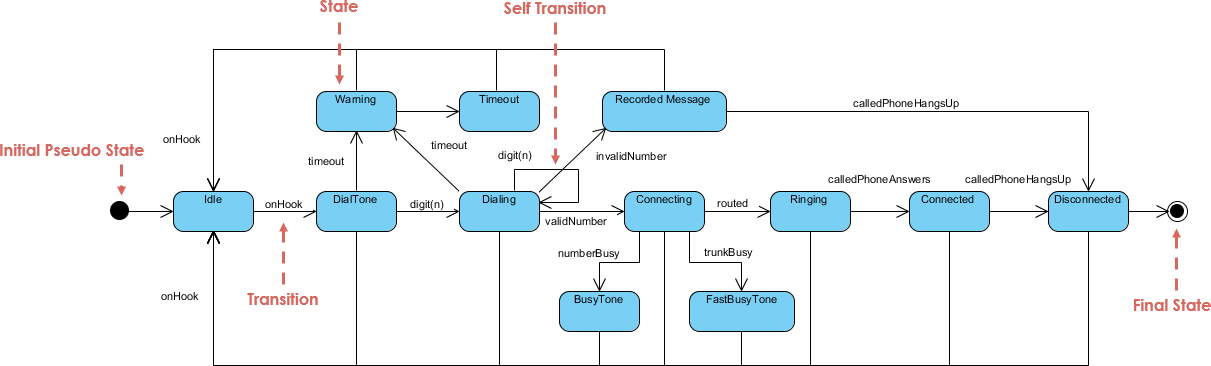
This comprehensive guide will walk you through the process of creating a UML State Diagram from scratch. We will explore the fundamental concepts, provide a practical step-by-step tutorial using a real-world example, and discuss how modern tools like Visual Paradigm can streamline this process through AI-powered features.
What is a UML State Diagram?
A UML State Diagram illustrates the life cycle of a specific object or system. It details the states an object resides in, the transitions between those states, the events that trigger transitions, and the actions performed during the process. This type of diagram is particularly valuable for event-driven systems where behavior is dictated by external triggers rather than a sequential flow.
To create an effective diagram, you must understand its core elements:
- States: These represent specific conditions or situations in the lifecycle of an object (e.g., “Idle”, “Processing”, “Waiting for Input”).
- Transitions: Visualized as arrows, these indicate the movement from one state to another. They are usually triggered by specific events.
- Events: The triggers that cause a transition to happen, such as a user pressing a button, a system timeout, or a sensor reading.
- Actions/Guards: Actions are behaviors executed during a transition, while guards are Boolean conditions that must be true for a transition to occur.
As a subset of UML behavioral diagrams, state diagrams are essential in object-oriented design, embedded systems development, and business process modeling.
Step-by-Step Guide to Creating a UML State Diagram
Creating a robust state diagram follows a logical process. In this guide, we will model the behavior of a standard ATM Machine to demonstrate the steps effectively.
Step 1: Identify the Object or System to Model
Begin by clearly defining the scope of your diagram. You must identify the specific entity you are modeling and focus on its lifecycle from creation to destruction.
For our example, the object is the “ATM Session.” It is crucial to keep your diagram focused; aim to model one class or subsystem at a time to avoid unnecessary complexity and clutter.
Step 2: List All Possible States
Brainstorm every stable condition the object can occupy. States are typically named using nouns or adjectival phrases describing the condition.
For an ATM, the states might include:
- Idle: The machine is waiting for a card.
- Card Inserted: The machine has detected a card.
- PIN Entered: The user has provided input.
- Menu Displayed: Options are presented to the user.
- Transaction Processing: The system is communicating with the bank.
- Ejecting Card: The session is concluding.
- Error: A fault has occurred.
Always include an Initial State (represented by a filled circle) to mark the start, and a Final State (a circle with a border) to indicate the end of the lifecycle.
Step 3: Define Events and Transitions
Once states are defined, determine what causes the system to move between them. These are your events and transitions.
Examples for the ATM include:
- Event: “Card Inserted” triggers the transition from Idle to Card Inserted.
- Event: “PIN Verified” triggers the transition from Card Inserted to Menu Displayed.
Tip: Use solid arrows for transitions. Label them clearly using the standard format: event [guard] / action (e.g., “PIN Entered [PIN correct] / Proceed”).
Step 4: Add Guards, Actions, and Entry/Exit Behaviors
To make the diagram realistic and functional, you need to specify logic constraints and system behaviors.
- Guards: These are conditions that control the path. For example,
[balance sufficient]allows a withdrawal, whereas[insufficient funds]might trigger an error state. - Actions: Specific behaviors executed during the transition, such as “dispense cash” or “print receipt.”
- Entry/Exit Behaviors: Actions that occur immediately upon entering or leaving a state. For instance, when entering the PIN Entered state, an entry action might be “encrypt input.”
Step 5: Handle Concurrent States
Complex systems often perform parallel tasks. If your system requires concurrent behaviors—such as processing a transaction while simultaneously updating security logs—use regions separated by dashed lines within a composite state.
Step 6: Validate and Refine
Before finalizing, review the diagram for logical flow and completeness.
- Does the diagram cover all identified states?
- Are there any “dead ends” (states you cannot exit from) that shouldn’t exist?
- Is the visual layout readable?
Perform a mental walkthrough by simulating various user scenarios to ensure the flow makes sense.
Step 7: Document and Share
Add notes to complex areas to provide context. Once complete, export the diagram to a shared format (like PDF or PNG) for collaboration with developers and stakeholders.
Modern Tools: Boosting Workflow with AI
While manual diagramming is effective for learning, professional environments often require speed and iteration. Modern diagramming tools like Visual Paradigm have integrated AI-powered features to significantly reduce the time spent on drafting.
Visual Paradigm leverages AI to automate several tedious aspects of diagramming:
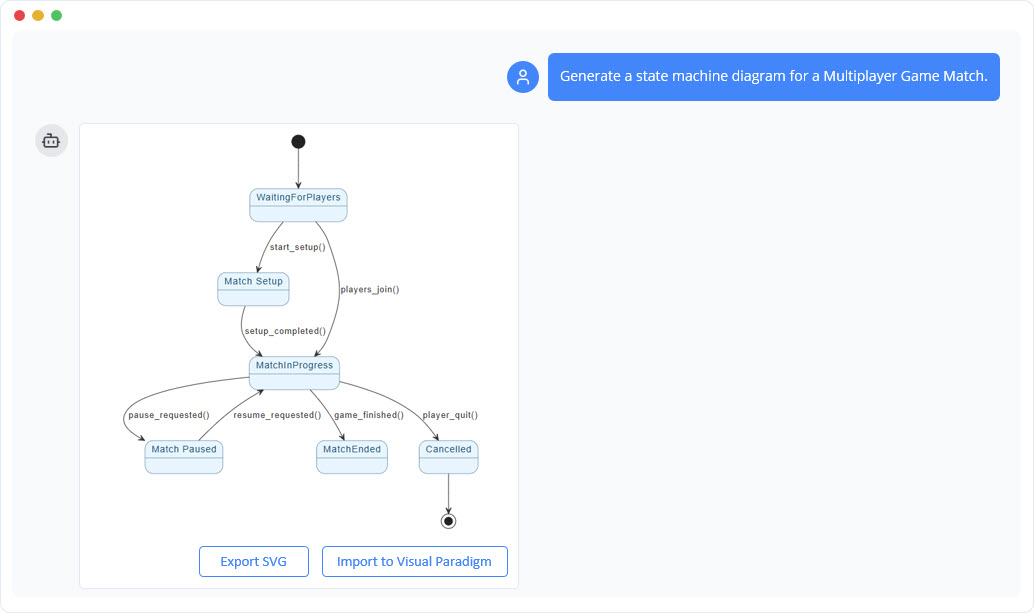
- AI Auto-Layout: You can upload a rough sketch or providing a text description, and the AI will generate a polished, logically arranged diagram.
- Natural Language Input: Developers can describe a system in plain English (e.g., “The ATM starts idle, waits for a card, verifies the PIN, and then processes a withdrawal”), and the tool parses this into a structured UML State Diagram. This can reduce manual drawing time by up to 80%.
- Intelligent Refinements: As you edit, the AI can detect inconsistencies, such as unreachable states, and offer suggestions for guards or layout optimizations.
- Model Integration: The tool helps maintain consistency by seamlessly linking state diagrams to other UML types, such as class or sequence diagrams.
Best Practices and Common Pitfalls
To ensure your diagrams are effective, adhere to these best practices:
- Keep It Simple: Avoid overcrowding a single diagram. If a system is too complex, break it down into sub-diagrams.
- Use Standard Notations: Stick to UML 2.5 specifications to ensure your diagrams are universally understood by other engineers.
- Avoid Over-Modeling: Not every process requires a state diagram. If the logic is linear without complex state changes, an activity diagram might be more appropriate.
- Watch for Pitfalls: Don’t forget “history states” (which allow a system to resume from its last point after an interruption) and always account for timeouts in transitions to prevent system hangs.
Conclusion
UML State Diagrams are invaluable assets for visualizing dynamic system behaviors, ensuring that designs are robust, logical, and clearly understood by the entire development team. By following this step-by-step guide, you can move efficiently from initial ideation to a refined technical model.
Furthermore, leveraging modern tools like Visual Paradigm can transform what was once a tedious documentation task into a streamlined, creative process. Whether you are a student or a seasoned architect, mastering state diagrams will significantly enhance your design workflow.
Visual Paradigm State Diagram Resource
The following articles and resources provide detailed information on using AI-powered tools to create, refine, and master UML state machine diagrams within the Visual Paradigm platform:
-
Mastering State Diagrams with Visual Paradigm AI: A Guide for Automated Toll Systems: This guide demonstrates how to utilize AI-enhanced state diagrams to model and automate the complex behaviors of an automated toll system.
-
AI-Powered UML Chatbot State Diagrams: This article explores the ways artificial intelligence improves the creation and interpretation of UML state diagrams specifically for the development of chatbot systems.
-
Definitive Guide to UML State Machine Diagrams with AI: This comprehensive resource provides a detailed guide on using AI-enhanced modeling tools to visualize object behavior through UML state machine diagrams.
-
Interactive State Machine Diagram Tool: This web-based platform allows teams to create and edit state machine diagrams in real time with generative AI support for faster software engineering workflows.
-
Visual Paradigm – UML State Machine Diagram Tool: This interactive online tool provides a dedicated interface for creating, editing, and exporting detailed UML state machine diagrams for modern software design.
-
AI Chatbot for Diagram and Model Generation: This AI-powered assistant enables users to generate various models, including state diagrams, through natural language interaction and simple text prompts.


")