


Unlock Clearer Systems Analysis with Specialized DFD Support
Visual Paradigm has advanced its commitment to structured analysis by launching dedicated support for the Gane and Sarson Data Flow Diagram (DFD) notation. For systems analysts and software engineers, this update represents a significant leap forward in creating precise, hierarchical system models. By integrating an environment optimized specifically for Gane-Sarson symbols and rules, teams can now analyze, document, and communicate complex information system requirements with unparalleled clarity and efficiency.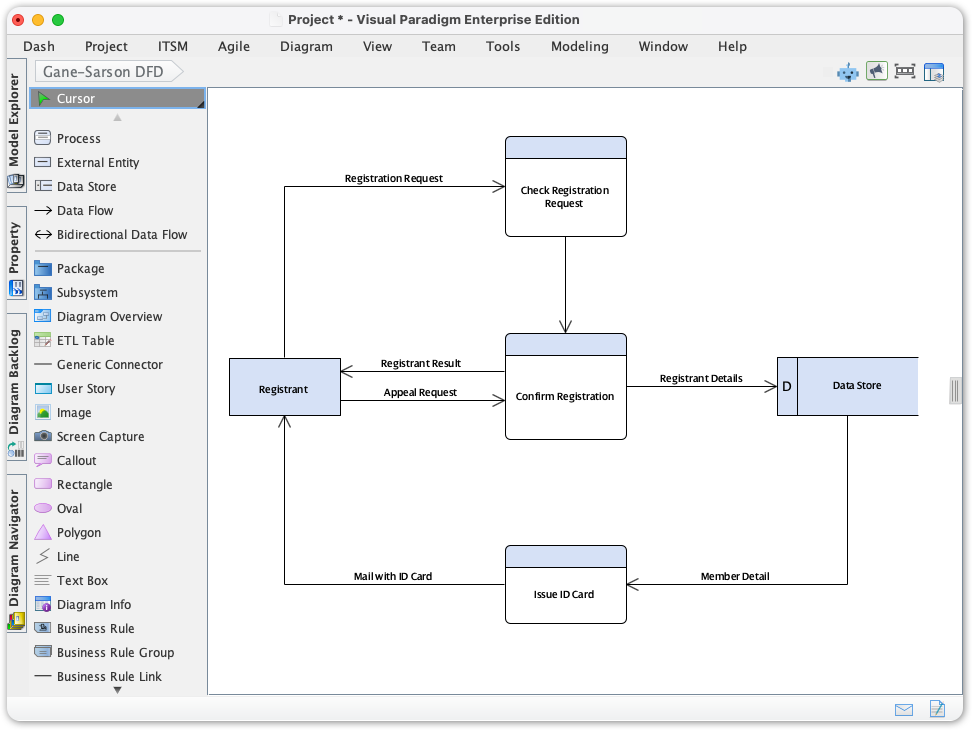
This comprehensive guide explores the core concepts of Gane and Sarson notation, how to leverage Visual Paradigm’s new features to overcome common modeling challenges, and best practices for delivering high-quality documentation.
Key Concepts: Understanding Gane and Sarson DFDs
Before diving into the tool, it is essential to understand the foundational elements of the Gane and Sarson notation style, which differentiates itself visually from other notations like Yourdon/DeMarco.
- The Process: Represents the transformation of data. In Gane and Sarson, this is typically depicted as a rounded rectangle (or soft box) containing an identification number, a description (verb-phrase), and the physical location or person performing the task.
- The Data Store: Represents data at rest. Distinctively, Gane and Sarson use an open-ended rectangle (open on the right side) to symbolize a database, file, or repository.
- The External Entity: Represents sources or destinations of data outside the system boundary. These are usually depicted as squares or rectangles with a shadowed effect to give a 3D appearance.
- Data Flow: Arrows connecting the other components, indicating the movement of information packets between processes, stores, and entities.
The Challenge of Consistency in Legacy Tools
Prior to this release, system analysts often faced significant obstacles when attempting to create robust Gane-Sarson DFDs using general-purpose diagramming tools. The primary friction points included:
- Notational Drift: Without dedicated symbol sets, maintaining the specific visual standards (such as the open data store symbols) across large projects was difficult, leading to inconsistent documentation.
- Redundant Work: Users spent valuable time manually aligning elements and resizing boxes to ensure uniformity, particularly when decomposing diagrams into lower, detailed levels.
- Poor Reusability: Manually reusing data stores and processes across different levels increased the risk of modeling errors and disconnected logic.
Guidelines: How to Access and Start Modeling
Visual Paradigm has streamlined the workflow to allow analysts to jump immediately into system analysis without configuring custom shapes. Follow these steps to begin:
- Access the Diagram Menu: Navigate to the application toolbar in Visual Paradigm Desktop and open the Diagram menu.
- Initiate Creation: Select New to open the diagram creation interface.
- Select the Standard: In the search or selection pane, type Gane-Sarson DFD.
- Confirm: Click Next to proceed.
- Start Modeling: You will now see the specialized Gane-Sarson elements in the diagram palette. Drag and drop these elements to define your processes and data flows.
Best Practices for Structured Analysis
To maximize the effectiveness of the new Gane-Sarson tools, adhere to these industry-standard best practices:
- Strict Leveling: Start with a Context Diagram (Level 0) that shows the system as a single process interacting with external entities. Decompose this into a Level 1 diagram to show major sub-processes.
- Balancing: Ensure that inputs and outputs are conserved between levels. If data enters a process at Level 1, it must be accounted for in the decomposition of that process at Level 2.
- Meaningful Naming: Use strong verb-noun phrases for processes (e.g., “Calculate Tax” rather than “Calculation”) and noun phrases for data stores (e.g., “Customer Database”).
- Reuse Elements: Utilize Visual Paradigm’s repository features to reuse data stores and external entities. This ensures that if a data store name changes, it updates across all diagrams.
Common Mistakes and How to Avoid Them
Even with advanced tools, logical errors can occur. Watch out for these pitfalls:
- Black Holes: A process that has input data flows but no output. Solution: Ensure every process generates data based on its input.
- Miracles: A process that generates output without any input. Solution: Check your logic; data cannot be created from nothing.
- The Grey Hole: A process where the output data cannot logically be derived from the input data (e.g., Input: “Date of Birth”, Output: “Home Address”). Solution: Verify that the inputs are sufficient to produce the desired outputs.
- Visual Clutter: Crossing data flow lines excessively. Solution: Use the automatic alignment tools to reorganize the layout, or duplicate external entities (marked with an asterisk) to simplify connections.
Tips and Tricks for Efficiency
Visual Paradigm’s update includes features that go beyond simple drawing:
- Leverage Automation: Use the intelligent alignment tools and snapping guides. Do not waste time manually nudging pixels; let the tool automatically organize elements for a professional layout.
- Focus on Requirements: Since the symbol compliance is handled by the software, shift your mental energy from “drawing” to “documenting.” Spend your time refining the logic of data flows within the system boundary. You can even enhance this process using tools for textual analysis to identify entities directly from specifications.
- Model with Authority: Use the specific Gane-Sarson palette to guarantee compliance with structured analysis standards. This is particularly useful when presenting to stakeholders who are sticklers for standard notation.
Example: Before and After
Consider the workflow of a system analyst documenting an “Order Processing System.”
Before (General Diagramming Tool)
The analyst manually draws a rectangle and tries to erase one side to create a data store. They copy-paste this shape 20 times. Later, they realize the shape is too small for the text “Inventory Database.” They resize one, but the other 19 remain small, creating an unprofessional, inconsistent look. The connections are static lines that do not track the objects when moved.
After (Visual Paradigm Gane-Sarson Support)
The analyst selects the “Data Store” tool from the Gane-Sarson palette. They drop it onto the canvas, and it automatically renders with the correct open-ended styling. When they type “Inventory Database,” the shape accommodates the text. Using the global repository, they reuse this specific data store in a Level 2 diagram. If they rename it to “Stock Repository,” it updates everywhere instantly. The snapping guides ensure it aligns perfectly with the “Check Stock” process.