


Introduction to Structured Analysis in Visual Paradigm
In the realm of software engineering and system design, structured analysis remains a cornerstone for understanding complex logic and data movement. Visual Paradigm Desktop has recently enhanced its modeling capabilities by introducing comprehensive support for the Yourdon and Coad Data Flow Diagram (DFD) notation. This update specifically targets the friction often associated with legacy system modeling, offering a dedicated environment to analyze, design, and document systems with speed and precision.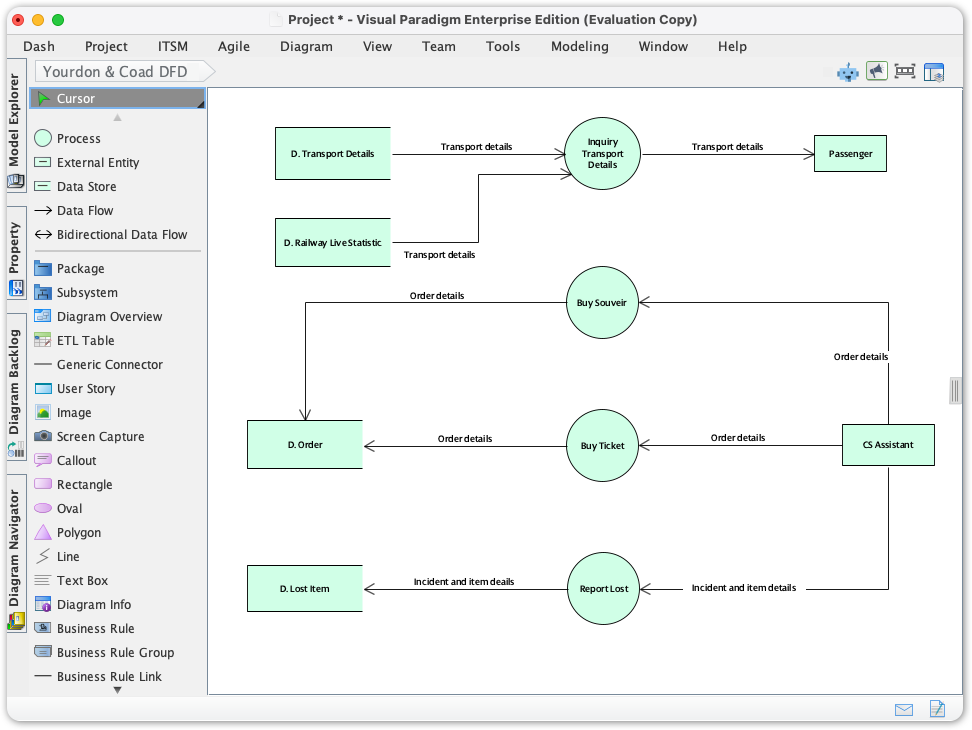
This guide explores the significance of this methodology, defines the core components, and provides a step-by-step workflow for utilizing these new tools to ensure model integrity and team alignment.
Key Concepts: Understanding Yourdon and Coad Notation
Before diving into the tooling, it is essential to understand the specific symbology that distinguishes the Yourdon and Coad method from other DFD notations (such as Gane-Sarson). This methodology focuses heavily on the flow of data through a system.
- Process (Circle/Bubble): Represents a function or transformation that converts inputs into outputs. In Yourdon and Coad, this is distinctively depicted as a circle.
- Data Flow (Arrow): Directed lines that represent the movement of data packets between processes, stores, and entities.
- Data Store (Parallel Lines): Represents data at rest (files, databases, or memory). The Yourdon notation typically uses two parallel lines, open at the ends.
- External Entity (Rectangle): Represents sources or destinations of data outside the system boundaries (e.g., Users, External APIs).
The Challenge of Generic Modeling
Prior to this release, architects often relied on generic shapes to replicate these diagrams. This led to several inefficiencies:
- Inconsistent Modeling: Teams struggled to maintain standard notation using basic drawing tools.
- Increased Overhead: Manual configuration of shapes to look like DFD symbols wasted valuable analysis time.
- Slower Analysis: The lack of a semantic understanding of the model slowed down the initial analysis phases.
Guidelines: How to Create Yourdon and Coad DFDs
Visual Paradigm has streamlined the workflow to allow for rapid deployment of standard symbols. Follow these steps to access the new feature:
- Navigate to the Diagram Menu: Open Visual Paradigm Desktop and locate the main toolbar. Click on the Diagram menu.
- Initiate New Diagram: Select New to open the diagram creation interface.
- Select the Notation: In the search or filter bar, type Yourdone & Coad (or browse the categories).
- Create the Canvas: Click Next and confirm to generate your workspace.
- Modeling: The specific palette for Yourdon and Coad will appear. Drag shapes like Process and Data Store directly onto the canvas to begin.
Best Practices for Model Integrity
To maximize the effectiveness of your structured analysis, adhere to the following industry standards regarding DFDs:
- Strict Adherence to Notation: Do not mix notations. If you are using Yourdon and Coad, ensure all processes are circles and data stores are parallel lines. Visual Paradigm’s dedicated palette enforces this to prevent errors.
- Hierarchical Decomposition: Start with a Context Diagram (Level 0) representing the entire system as a single process, then break it down into Level 1 and Level 2 diagrams.
- Labeling Conventions: Use strong Verb-Noun phrases for Processes (e.g., “Calculate Tax”) and Noun phrases for Data Flows and Stores (e.g., “Tax Rates”).
- Balance the Flow: Ensure that inputs and outputs at a lower level match the inputs and outputs of the parent process at the higher level.
Tips and Tricks for Efficiency
Leverage the advanced features of Visual Paradigm to speed up your workflow:
- Focus on Logic, Not Layout: Use the built-in smart alignment and layout tools. This prevents the diagram from becoming cluttered and allows you to focus entirely on the system logic rather than pixel-perfect positioning.
- Reuse Components: You can reuse modeling components across different diagrams. If an External Entity (e.g., “Customer”) exists in another model, reuse it to maintain a single source of truth within your project.
- Rapid Prototyping: Use the resource catalog (often accessed by dragging out from a selected shape) to quickly create connected shapes without returning to the toolbar.
Examples: Before and After
To visualize the impact of dedicated tooling, consider the following scenario of modeling a User Registration System.
Scenario A: Using Generic Tools (The Old Way)
The Experience: The user draws a circle using a basic drawing tool. They manually type “Validate Input” inside. They draw two lines for a database but struggle to get them parallel. The connections are not semantic, meaning the software doesn’t know the arrow represents data flow. Moving the circle breaks the line connection.
Scenario B: Using Yourdon and Coad Support (The New Way)
The Experience: The user selects “Process” from the Yourdon-Coad palette. A perfect circle appears. They name it “Validate Input”. They drag a connector out, and the tool suggests a “Data Store” target automatically. The diagram creates a semantic link. When the layout is re-arranged, the data flows adjust automatically, maintaining the logical structure. The resulting diagram is standards-compliant and ready for professional documentation.