


Introduction
In the fast-paced environments of modern business, engineering, and manufacturing, problems often manifest as recurring symptoms rather than isolated incidents. Applying quick fixes—often referred to as “band-aids”—might resolve the immediate issue, but it rarely prevents the problem from returning. To achieve lasting operational excellence, teams must dig deeper.
The 5 Whys Root Cause Analysis Tool is a specialized software application designed to guide professionals through the systematic process of uncovering the fundamental reasons behind failures. By combining the traditional 5 Whys methodology with modern AI capabilities and structured data management, this tool transforms chaotic troubleshooting into a streamlined, documented, and effective strategy.
Key Concepts
Before effectively utilizing the tool, it is crucial to understand the foundational terminology and concepts that drive the 5 Whys methodology. A solid grasp of these definitions ensures that your analysis is rigorous and meaningful.
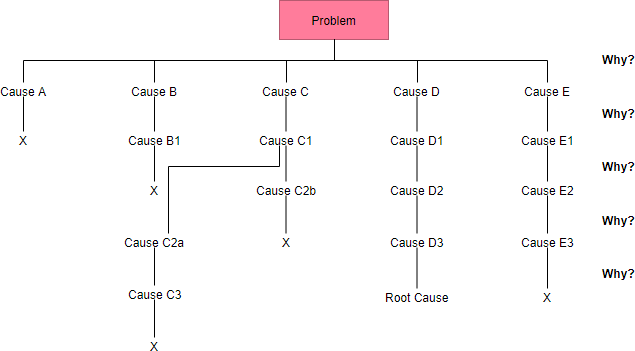
- 5 Whys Methodology: A problem-solving technique developed by Sakichi Toyoda (Toyota Industries) that explores cause-and-effect relationships by repeatedly asking “Why?” usually five times, to drill down to the root cause.
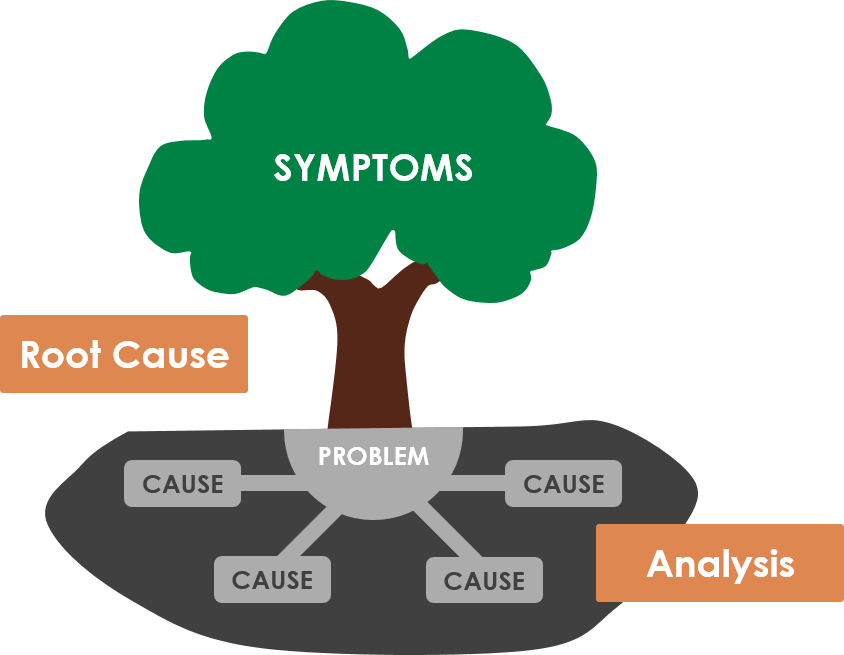
- Root Cause: The fundamental, underlying issue that, if permanently resolved, prevents the problem from recurring. It distinguishes itself from proximate causes or symptoms.
- Problem Definition: The initial step of the analysis. It is a concise, objective description of the issue, focusing on facts (what, where, when) rather than assumptions.
- Dynamic Data Tables: The core interface element of the tool. These are interactive grids that allow users to add, edit, or delete rows to structure their chain of questioning and solution development.
- Action Plan: The specific, measurable steps assigned to team members to implement the identified solutions and monitor their effectiveness.
Core Features of the Tool
This application is built for Project Managers, Engineers, and Business Analysts who require a distraction-free environment to solve complex issues. Below are the standout features that distinguish this tool from general note-taking software.
AI-Powered Analysis Generation
One of the most powerful features is the integration of Artificial Intelligence. Instead of staring at a blank screen, users can input their company context and a brief problem statement.

The AI then generates a comprehensive draft, including:
- A refined problem definition.
- A suggested chain of 5 Whys.
- Potential solutions for the identified root cause.
- A preliminary action plan.
This feature acts as a force multiplier, saving hours of brainstorming time and providing a solid foundation for refinement.
Data Privacy and Security
For organizations handling sensitive operational data, cloud storage can be a liability. The 5 Whys Tool prioritizes privacy by using Local Save functionality. When you save a project, it downloads a .json file directly to your computer. No analysis data is stored on external servers, ensuring your trade secrets and internal process failures remain private.
Step-by-Step Wizard Interface
The tool utilizes a 5-step wizard to enforce discipline. It prevents users from jumping straight to solutions before fully understanding the problem. The tracker ensures you complete the Problem Definition, the Analysis, Solution Development, and Implementation Planning in the correct logical order.
Practical Example: Analysis of a Shipping Delay
To demonstrate the tool’s effectiveness, let us look at a “Before and After” scenario using a logistics company facing recurring late deliveries. This example illustrates how the tool structures unstructured data.
Scenario Context
Company: Global Logistics Co.
Problem: Shipments to the West Coast region have been delayed by 48 hours for three consecutive weeks.
The Analysis Workflow
| Step | Tool Input / Action | Output / Result |
|---|---|---|
| 1. Problem Definition | User enters: “West Coast shipments delayed 48 hours.” | The tool prompts for impact. User adds: “Customer satisfaction down 15%, causing refund requests.” |
| 2. 5 Whys Analysis | User asks: “Why are shipments delayed?” Answer: “Trucks are leaving the warehouse late.” User asks: “Why are trucks leaving late?” User asks: “Why does loading take longer?” User asks: “Why are batteries dying?” User asks: “Why are they not charged?” |
The tool captures this chain in the Dynamic Data Table, identifying the Root Cause as a lack of process/accountability for equipment maintenance, rather than just “slow drivers.” |
| 3. Solution Development | User proposes: “Assign ‘Charging Check’ to the night shift supervisor.” | The tool links this specific solution directly to the root cause identified in Step 2. |
| 4. Action Plan | User assigns: “Update Shift Checklist” to Operations Manager. | A printable list of tasks with owners and deadlines is generated. |
How to Use the Tool: A Standard Workflow
Follow this guide to conduct a full manual or AI-assisted analysis.
Step 1: Context and Definition
Launch the tool and enter your “Company Name” and “Industry Context” at the top. This is critical for the AI to understand your business jargon. Proceed to the Problem Definition table. If you are using AI, click “Generate with AI” and describe the issue. If working manually, add rows to define what is broken, the magnitude of the impact, and the desired state.
Step 2: The Drill Down (The Whys)
In the “5 Whys Analysis” step, the goal is to move from the symptom to the cause. Ensure that each answer in the “Answer” column logically leads to the question in the next row.
Tip: You are not limited to exactly five whys. Use the “Add Row” button if the problem is complex and requires deeper investigation.
Step 3: Solution Generation
Once the root cause is isolated, move to the “Solution Development” step. Avoid generic solutions like “Train the team.” Instead, focus on process changes that make the error impossible to repeat (poka-yoke). Use the table to list multiple potential solutions and select the most viable ones.
Step 4: Implementation
Solutions are useless without execution. In the “Implementation & Monitoring” step, outline specific tasks. Who is doing what? By when? How will you measure success? This creates accountability.
Step 5: Final Report and Export
Navigate to the “Final Report” tab. The tool aggregates all previous steps into a clean, professional document. Click “Print Report” to generate a PDF for stakeholder review, or click “Save Project” to download the .json file for future editing.
Best Practices for Success
To maximize the value of the 5 Whys Root Cause Analysis Tool, consider the following best practices:
- Focus on Processes, Not People: When answering “Why,” never stop at “Human Error.” Always ask why the process allowed the human error to occur or go undetected.
- Verify AI Outputs: While the AI generation is powerful, it is a draft. Always review the logic to ensure it fits your specific operational reality.
- Save Frequently: Since the tool operates locally, there is no cloud auto-save. Get in the habit of clicking “Save Project” after completing each major step.
- Collaborate: Use the printed report to facilitate team discussions. The 5 Whys is most effective when diverse perspectives (engineering, ops, management) contribute to the answers.
Conclusion
The 5 Whys Root Cause Analysis Tool bridges the gap between theoretical problem-solving frameworks and practical application. By providing a structured, interactive, and intelligent environment, it empowers teams to move beyond symptom management and achieve true process improvement. Whether you are a project manager leading a post-mortem or an engineer debugging a system failure, this tool ensures your analysis is thorough, documented, and actionable.