


Introduction
Data modeling is the backbone of robust system architecture, and for decades, the Chen Entity-Relationship Diagram (ERD) notation has stood as the academic and professional gold standard for conceptual modeling. With the recent release of native support for Chen ERD notation in Visual Paradigm Desktop, data architects, business analysts, and students can now leverage this precise methodology without resorting to awkward workarounds.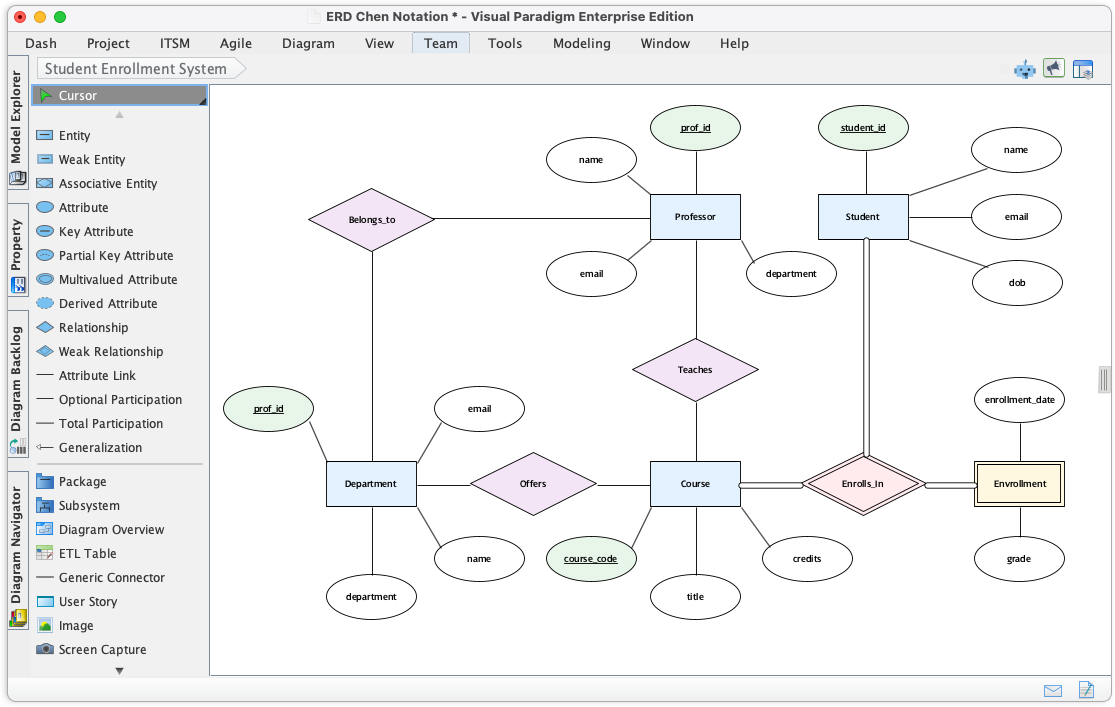
This comprehensive guide explores the significance of this update, explains the foundational concepts of Chen’s notation, and provides a step-by-step workflow for creating rigorous conceptual data models within Visual Paradigm.
Key Concepts in Chen ERD Notation
Before diving into the software, it is crucial to understand the definitions that make Chen notation unique. Unlike the Crow’s Foot notation often used in physical database design, Chen notation focuses heavily on the abstract, semantic relationship between data objects.
1. The Entity (Rectangle)
In Chen notation, an Entity represents a distinguishable object in the real world—such as a ‘Customer’, ‘Product’, or ‘Employee’. These are visually represented by rectangles. An entity is not a table; it is a conceptual object that will eventually be translated into a table during the physical design phase.
2. The Attribute (Oval)
Attributes describe the properties or characteristics of an entity. In this notation, they are distinctively represented by ovals connected to their respective entity by a line. This differs from other notations where attributes are often listed inside the entity box.
- Standard Attribute: A simple oval (e.g., ‘Color’, ‘Date’).
- Key Attribute: Represented by an oval with underlined text. This denotes the unique identifier (Primary Key) for the entity.
3. The Relationship (Diamond)
The core of the Entity-Relationship model is the Relationship, represented by a diamond shape. This shape connects associated entities and describes how they interact (e.g., a Customer ‘Places’ an Order). The diamond shape allows for a clear visual separation between objects (nouns) and interactions (verbs).
The Importance of Native Support
Prior to this update, users seeking the conceptual clarity of Chen notation faced a fragmented workflow. Architects often had to manually manipulate generic shapes or switch to disconnected external tools to achieve the visual standard required by academia and rigorous system design. This led to inconsistent diagram quality and wasted time on formatting.
Visual Paradigm’s new native integration resolves these challenges by providing a dedicated environment where the syntax rules of Chen notation—rectangles, ovals, and diamonds—are built-in, ensuring that your diagrams are not only visually accurate but also semantically valid.
Guidelines: Implementing Chen Notation in Visual Paradigm
Follow these steps to access and utilize the new Chen ERD tools within Visual Paradigm Desktop. These guidelines ensure you start your project with the correct configuration.
Step 1: Accessing the Feature
- Launch Visual Paradigm Desktop.
- Navigate to the top toolbar and select the Diagram tab.
- Click New to open the diagram creation interface.
- In the search bar, type Chen Notation ERD.
- Select the diagram type to initialize the canvas.
Step 2: Defining Entities
Once the canvas is open, the shape toolbar will update to reflect the specific Chen syntax. Begin by dragging the Rectangle shape onto the canvas to define your core entities. Name them using singular nouns (e.g., ‘Student’ rather than ‘Students’) to adhere to best practices.
Step 3: Adding Attributes
Select the Oval shape to add attributes. Connect them to your entities using simple link lines. Ensure that every entity has at least one unique identifier. To designate a Key Attribute, use the text formatting options to underline the attribute name within the oval, signaling that this is the primary key.
Step 4: establishing Relationships
Drag the Diamond shape between two entities to define their relationship. Label the diamond with a verb phrase describing the interaction. Use connecting lines to link the diamond to the related entities. You can further define cardinality (1:1, 1:N, M:N) using text annotations near the connection points.
Tips and Tricks for Efficient Modeling
To maximize your productivity and ensure high-quality outputs, consider these practical tips when working with the new Chen ERD features.
Leverage the AI Diagram Generator
If you are starting from a blank slate or facing writer’s block, utilize Visual Paradigm’s AI Diagram Generator. This tool can instantly draft ERDs and Data Flow Diagrams (DFDs) based on text prompts. You can use the AI to generate a baseline structure and then convert or refine it using the specific Chen notation shapes for a more formal conceptual presentation.
Focus on Conceptual Clarity
Chen notation is designed for high-level abstraction. Avoid cluttering your diagram with physical data types (like VARCHAR or INT) at this stage. Focus on the relationships and business rules. If you need to show database specifics, consider creating a separate Physical ERD linked to your Conceptual Chen model.
Use Color Coding for readability
While the shapes (rectangles, diamonds, ovals) provide structure, large diagrams can become difficult to read. Apply a consistent color scheme:
- Blue for Entities.
- Green for Relationships.
- Yellow for Attributes.
This visual distinction helps stakeholders quickly parse complex data structures during presentations.
Conclusion
The introduction of native Chen ERD notation support in Visual Paradigm Desktop marks a significant step forward for data architects who prioritize conceptual rigor. By eliminating the need for workarounds and providing a dedicated toolset for rectangles, ovals, and diamonds, Visual Paradigm empowers users to build rock-solid foundations for their relational databases. Whether you are a student learning the classics of data theory or an architect designing complex systems, these tools ensure your models are communicated with unmatched clarity and precision.