Understanding system architecture requires more than just knowing what components exist. It demands clarity on how those components interact. Communication Diagrams offer a structural view of object interactions, focusing on the relationships between objects rather than the strict timing found in other models. This guide provides a comprehensive breakdown of their mechanics, syntax, and application within software design.
What is a Communication Diagram? 📊
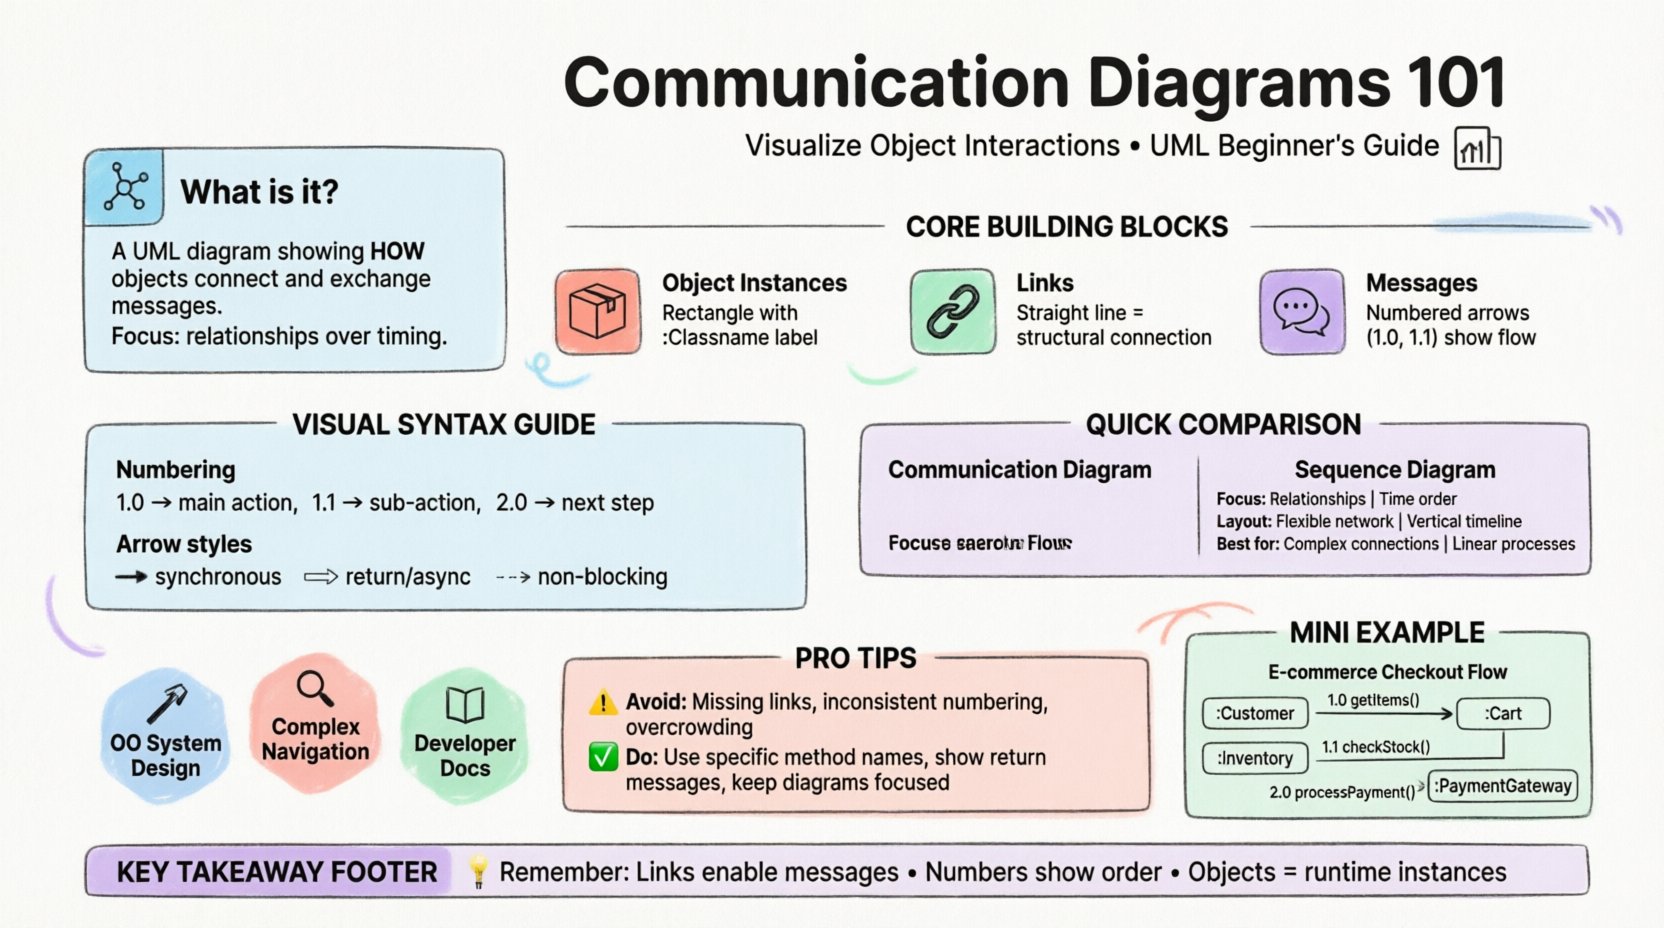
A communication diagram is a type of interaction diagram used in Unified Modeling Language (UML). While sequence diagrams focus on the chronological order of events, communication diagrams prioritize the organization and connectivity of objects. They depict the system as a set of connected objects, showing how messages pass between them.
Think of it as a map of the system’s internal traffic. Instead of a timeline, you see a network. This makes it easier to visualize the physical or logical topology of the interaction.
- Primary Focus: Object relationships and message flow.
- Secondary Focus: Sequence of events (indicated by numbers).
- Context: Part of the UML behavioral modeling family.
In many professional settings, these diagrams are used during the design phase to ensure that every object knows which other objects it needs to contact to function correctly. They bridge the gap between static structure diagrams and dynamic behavior diagrams.
Core Building Blocks 🧱
To construct a valid communication diagram, you must understand the fundamental elements that make up the visual representation. Each element carries specific semantic weight.
1. Object Instances 📦
Objects represent specific instances of classes within the system. Unlike a class diagram which defines a blueprint, this diagram shows the active participants at runtime.
- Shape: Typically represented as a rectangle.
- Labeling: Contains the object name, often prefixed with a colon (e.g.,
:Order) to indicate an instance of the Order class. - Multiplicity: Can show how many instances exist (e.g.,
1..*), though often simplified to a single instance for clarity.
2. Links 🔗
Links represent the structural connections between objects. If Object A has a reference to Object B, a link exists between them. This is crucial because messages can only travel between connected objects.
- Visual: A straight line connecting two object boxes.
- Meaning: Represents a relationship, such as an association or aggregation.
- Direction: Often bidirectional, but can imply a specific navigational path.
3. Messages 💬
Messages are the actions one object performs on another. They drive the behavior of the system. In this diagram type, messages are the primary actors on the stage.
- Form: Arrows drawn between objects.
- Label: Text describing the method or operation being invoked.
- Sequence: Numbered to indicate the order of execution.
Understanding the Visual Syntax 🔢
The syntax of a communication diagram is distinct from other interaction diagrams. It relies on a numbering system to convey time, while relying on geometry to convey structure.
Numbering Convention
Unlike a sequence diagram where position on the vertical axis implies time, communication diagrams use explicit numbers. This allows the objects to be placed anywhere on the canvas, provided the flow is clear.
- 1.0: The first message sent in the interaction.
- 1.1: A sub-message or return message within the scope of 1.0.
- 2.0: The next distinct action after 1.0 completes.
Arrow Styles
The type of arrow conveys information about the nature of the message.
- Solid Line with Filled Arrowhead: Indicates a synchronous call. The sender waits for a response.
- Open Arrowhead: Often used for return messages or asynchronous signals.
- Dashed Line: Can indicate a return value or a non-blocking signal, depending on the specific notation standard.
Step-by-Step Reading Guide 📖
Reading a communication diagram requires a different cognitive approach than reading a sequence diagram. You must trace the path of the message through the network of objects.
- Identify the Entry Point: Look for the object that initiates the process. This is usually the external actor or the top-level controller.
- Follow the Numbers: Start with the message labeled “1”. Trace the arrow to the destination object.
- Check the Link: Ensure a physical line connects the two objects. If there is no link, the message cannot be delivered.
- Trace Sub-sequences: Look for numbers like 1.1 or 1.2. These indicate actions triggered by the initial message.
- Identify Loops: If a message returns to a previous object or creates a cycle, look for recursive numbering or loops in the arrow path.
- Verify Completion: Ensure every initiated action has a corresponding return or termination point.
Comparison with Sequence Diagrams 🆚
Both diagrams model interactions, but they serve different analytical purposes. Understanding the differences helps you choose the right tool for the documentation task.
| Feature | Communication Diagram | Sequence Diagram |
|---|---|---|
| Primary Focus | Object relationships and topology | Time and chronological order |
| Layout | Flexible placement of objects | Vertical timeline with lifelines |
| Message Flow | Explicit numbering | Vertical position implies time |
| Readability | Good for complex connections | Good for long, linear processes |
| Complexity | Can become cluttered with many objects | Can become very tall with many messages |
When the system has a complex web of connections, the communication diagram shines. When the process is a long, linear transaction, the sequence diagram is often more intuitive.
When to Use This Model 🛠️
Deciding to use a communication diagram depends on the specific needs of the design phase. It is not a universal replacement for all interaction modeling.
1. Designing Object-Oriented Systems
Since these diagrams rely heavily on object instances and links, they are ideal for object-oriented designs. They help verify that the class relationships defined in the static model actually support the required interactions.
2. Analyzing Complex Navigation
If the system involves complex navigation patterns (e.g., a user clicking through a hierarchy of menus), a communication diagram can show the path of data retrieval across multiple objects without the vertical clutter of a sequence diagram.
3. Documentation for Developers
Developers often need to know which classes are coupled. This diagram makes coupling explicit through the links. It serves as a reference for understanding dependencies between modules.
Common Mistakes to Avoid ⚠️
Even experienced modelers can introduce errors that make the diagram misleading. Avoid these common pitfalls to maintain accuracy.
- Missing Links: Drawing a message arrow without a structural link between the objects. Messages cannot exist without a relationship.
- Inconsistent Numbering: Skipping numbers or using non-sequential steps (e.g., 1, 3, 5) without explanation. This breaks the logical flow.
- Overcrowding: Trying to model the entire system lifecycle in one diagram. If the diagram becomes too dense, it loses its purpose. Split complex scenarios into multiple diagrams.
- Ambiguous Labels: Using generic terms like “Process Data” instead of specific method names like
calculateTotal(). Specificity aids implementation. - Ignoring Return Messages: Forgetting to show the response. While sometimes implied, showing the return path clarifies the synchronous nature of the call.
Rules and Standards 📜
Adhering to established modeling rules ensures that the diagram is readable by anyone familiar with UML. Deviating from these standards creates confusion.
- Rule 1: Every message must have a start and end point. It cannot float in empty space.
- Rule 2: Numbers must follow a logical hierarchy. Sub-actions must be indented or numbered relative to the parent action.
- Rule 3: Object names should be consistent with the class names in the static model.
- Rule 4: Links should not cross unnecessarily. If possible, route connections to minimize visual noise.
- Rule 5: Use the same arrowhead style for the same type of interaction throughout the document.
Deep Dive: The Lifecycle of a Message 🔄
To truly understand these diagrams, one must look at what happens to a message during the interaction. It is not just a line on a page; it represents a state change.
Activation
When a message is sent, the receiving object becomes active. In a sequence diagram, this is shown as a rectangle on the lifeline. In a communication diagram, this is implied by the incoming arrow.
Execution
The object performs the operation. This might trigger other messages (recursive calls). The communication diagram captures this branching by showing new arrows originating from the same object.
Return
Once the operation is complete, control returns to the sender. In synchronous calls, the sender waits. In asynchronous calls, the sender continues. The diagram distinguishes this through arrow styles and numbering.
Practical Example Scenario 📝
Consider a simple e-commerce checkout process. The following steps outline how the interaction looks in this format.
- Step 1: The Customer object sends a message to the Cart object to retrieve items.
- Step 2: The Cart object sends a message to the Inventory object to check stock.
- Step 3: The Inventory object sends a confirmation back to the Cart.
- Step 4: The Cart object sends a message to the PaymentGateway to process funds.
In a diagram, the Cart object sits in the center, connected to all other objects. The arrows radiate from it. The numbering clarifies that the Payment step only happens after the Inventory check.
Advanced Considerations 🔍
For complex systems, standard communication diagrams may need extensions to handle advanced behaviors.
1. Iteration and Loops
If a message is sent repeatedly (e.g., processing a list of items), the diagram should indicate the loop. This is often done by labeling the message with “*” or “i” to denote iteration.
2. Exception Handling
What happens if a message fails? Communication diagrams can show alternative paths. For example, if the Inventory check fails, a message might go to an Notification object instead of the Payment Gateway.
3. Concurrency
Multiple messages can be sent simultaneously. In this case, they share the same sequence number (e.g., 1.1 and 1.2 happening in parallel). This requires clear labeling to avoid confusion about dependency.
Summary of Key Takeaways 🎯
Communication diagrams provide a structural view of system interactions. They emphasize the links between objects over the strict timeline of events. By using numbers to denote sequence and lines to denote relationships, they offer a flexible way to document behavior.
Key points to remember include:
- Objects represent active instances, not just classes.
- Links must exist for messages to be valid.
- Numbering replaces vertical positioning for time.
- They complement sequence diagrams rather than replace them.
Mastering these diagrams improves the clarity of software architecture documentation. It allows teams to visualize dependencies and potential bottlenecks before writing a single line of code.
Frequently Asked Questions ❓
Can I use this for non-software systems?
Yes. While primarily used in software engineering, the principles apply to any system involving interacting components, such as business processes or hardware architecture.
Is the numbering mandatory?
In strict UML, yes. It is the primary way to define order in this specific diagram type. However, some tools allow implicit ordering based on position, though this reduces clarity.
How do I handle large systems?
Break the system into subsystems. Create a high-level communication diagram for the architecture, and detailed diagrams for specific modules. Do not attempt to model the entire enterprise in a single view.