In the rapidly evolving landscape of software development, the architecture of a system defines its stability, scalability, and maintainability. For decades, the package diagram has served as a fundamental blueprint for understanding the structure of codebases. However, as organizations shift toward continuous integration and continuous deployment (CI/CD), the role of these static visualizations is undergoing a significant transformation. This guide explores the enduring value of package diagrams and how they integrate into modern DevOps practices without relying on specific vendor tools or hype.
Understanding the Package Diagram 📐
A package diagram is a type of UML (Unified Modeling Language) diagram that organizes elements into groups or packages. These packages represent modules, namespaces, or subsystems within a larger system. The primary purpose is to visualize the relationships between these high-level components, such as dependencies, associations, and generalizations.
- Encapsulation: Shows which internal details are hidden from other packages.
- Dependencies: Illustrates how one package relies on another to function.
- Cohesion: Helps measure how closely related the elements within a package are.
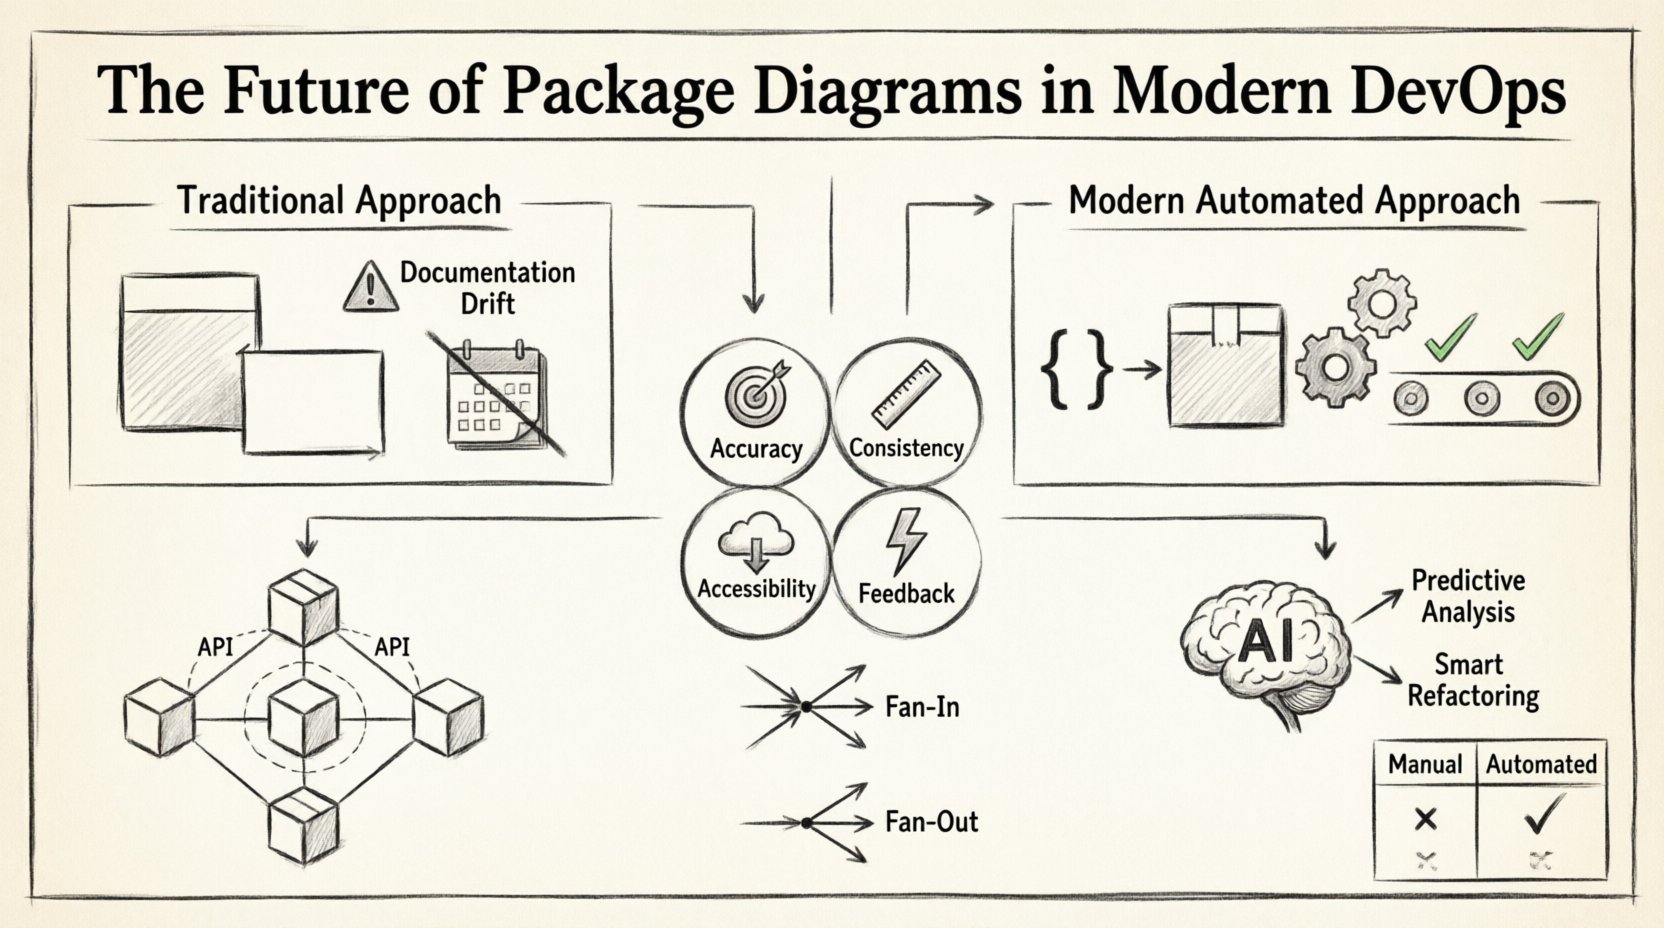
Traditionally, these diagrams were drawn manually during the design phase and stored as static images or documents. While this approach provided a clear snapshot of the intended architecture, it often failed to keep pace with the velocity of modern development. Code changes frequently outstrip documentation updates, leading to a state known as documentation drift.
The DevOps Shift 🔄
DevOps emphasizes collaboration between development and operations teams, aiming to shorten the systems development life cycle. In this environment, speed and reliability are paramount. Static diagrams created at the beginning of a project often become obsolete within weeks of the first deployment. This creates a disconnect between the as-designed architecture and the as-built reality.
Modern DevOps practices require architecture artifacts to be living documents. The package diagram must evolve alongside the code. This integration brings several challenges and opportunities:
- Velocity vs. Accuracy: Teams move fast, but accurate diagrams require time to update.
- Visibility: Operations teams need to understand dependencies to manage infrastructure effectively.
- Compliance: Regulatory requirements often mandate up-to-date architectural documentation.
To succeed, the package diagram must transition from a manual drawing exercise to an automated artifact generated from the source code itself.
The Problem of Documentation Drift 📉
Documentation drift occurs when the written or visual documentation no longer matches the actual state of the software. In the context of package diagrams, this happens when developers add new dependencies or refactor existing structures without updating the diagram. Over time, the diagram becomes misleading, causing confusion during troubleshooting or onboarding new team members.
Signs of significant documentation drift include:
- Merge Conflicts: Multiple teams modifying the same architectural boundaries without coordination.
- Hidden Dependencies: Packages relying on internal implementation details of others, creating tight coupling.
- Circular References: A and B depend on each other, creating a cycle that complicates deployment.
When drift occurs, the package diagram loses its value as a communication tool. Developers stop trusting it, and it becomes merely a decorative element in a wiki page. Addressing this requires a shift in workflow, where diagram maintenance is treated as a code quality metric.
Automating Diagram Generation 🤖
The most effective way to combat documentation drift is automation. Instead of drawing diagrams manually, systems can parse the source code to generate package diagrams dynamically. This approach ensures that the visualization always reflects the current state of the repository.
Automated generation typically involves the following steps:
- Static Analysis: A tool scans the codebase to identify namespaces, classes, and interfaces.
- Dependency Mapping: The system analyzes import statements, method calls, and interface implementations to map relationships.
- Visualization: The mapped data is rendered into a standard diagram format.
- Version Control: The generated diagram is committed alongside the code changes.
This process integrates seamlessly into the build pipeline. Every time a pull request is submitted, the pipeline can validate that the new code does not violate architectural boundaries defined by the package diagram. If a developer attempts to introduce a dependency that breaks the rules, the build fails. This enforces discipline and keeps the architecture clean.
Benefits of Automation
- Accuracy: The diagram is always in sync with the code.
- Consistency: Formatting and style remain uniform across the entire system.
- Accessibility: Diagrams are regenerated on demand, reducing storage overhead.
- Feedback: Immediate feedback on architectural violations during the coding process.
Microservices and Distributed Systems 🌐
The rise of microservices architecture has added complexity to the package diagram. In a monolithic application, a package represents a logical grouping within a single codebase. In a distributed system, a package often corresponds to a service or a domain boundary. The relationships between these services are critical for understanding data flow and failure points.
When visualizing microservices, the package diagram serves as a high-level map of the ecosystem. It helps teams identify:
- Service Boundaries: Where does one service end and another begin?
- API Contracts: How do services communicate with each other?
- Shared Libraries: Are there common packages being reused across multiple services?
- Choreography vs. Orchestration: How are business processes distributed?
It is crucial to avoid coupling between services. The package diagram helps visualize these boundaries. If Package A in Service X directly accesses internal classes of Package B in Service Y, it indicates a violation of the microservice principle. This coupling makes independent deployment difficult and increases the risk of cascading failures.
Integrating into CI/CD Pipelines 🚀
Continuous Integration and Continuous Deployment pipelines are the backbone of modern delivery. Integrating package diagram validation into these pipelines ensures that architectural integrity is maintained automatically. This integration turns the diagram into a gatekeeper for code quality.
The workflow typically looks like this:
- Commit: Developer pushes code to the repository.
- Analysis: The pipeline runs a static analysis tool to generate a temporary diagram.
- Comparison: The new diagram is compared against the baseline (previous commit).
- Validation: Rules are checked to ensure no new violations (e.g., circular dependencies).
- Report: A summary of architectural changes is generated for the team.
If the validation passes, the build proceeds. If it fails, the developer receives a notification detailing the specific architectural breach. This creates a culture where architecture is everyone’s responsibility, not just the senior architect’s.
Best Practices for Maintenance 🛠️
Even with automation, human oversight remains necessary. Automated tools provide the data, but humans provide the context. Here are best practices for keeping package diagrams relevant and useful.
- Define Clear Packages: Establish naming conventions and logical groupings early in the project.
- Limit Depth: Avoid nesting packages too deeply. Three levels is usually sufficient for clarity.
- Review Regularly: Include diagram review in sprint retrospectives or architecture governance meetings.
- Focus on Interfaces: Document the public interfaces of packages, not just the internal implementation.
- Keep it Simple: Avoid cluttering the diagram with every single class. Focus on the structure.
Comparison: Manual vs. Automated Approaches 📊
To better understand the shift in strategy, consider the following comparison between traditional manual methods and modern automated approaches.
| Feature | Manual Approach | Automated Approach |
|---|---|---|
| Accuracy | High risk of drift over time | High accuracy, always up-to-date |
| Maintenance Effort | High (requires dedicated time) | Low (runs in background) |
| Cost | High (human hours) | Low (compute resources) |
| Feedback Speed | Delayed (post-release) | Immediate (during coding) |
| Consistency | Varies by author | Standardized by tool |
The table highlights that while manual diagrams offer flexibility in design, they struggle with the dynamic nature of modern software. Automated approaches align better with the principles of DevOps and continuous improvement.
Metrics and Quality Indicators 📈
Package diagrams are not just for visualization; they are a source of quantitative data. By analyzing the structure of packages, teams can derive metrics that indicate the health of the software.
- Fan-In: The number of other packages that depend on a specific package. High fan-in indicates a core, reusable component.
- Fan-Out: The number of other packages a specific package depends on. High fan-out suggests a component that is heavily coupled to the rest of the system.
- Afferent Coupling: Measures how much the package is affected by changes in other packages.
- Efferent Coupling: Measures how much the package affects other packages.
Monitoring these metrics helps identify technical debt. For example, a package with high efferent coupling but low fan-in is a candidate for refactoring or removal. A package with high fan-in and high fan-out is a bottleneck that requires careful management.
Future Trends and AI Integration 🤖
Looking ahead, the integration of artificial intelligence into architecture documentation is becoming a reality. AI models can analyze codebases to suggest optimal package structures or identify potential refactoring opportunities.
Potential developments include:
- Predictive Analysis: AI predicting where dependencies might cause issues before they happen.
- Smart Refactoring: Automated suggestions to break down large packages into smaller, more manageable units.
- Natural Language Queries: Asking questions like “Show me the dependency path between Service A and Service B” and receiving an instant diagram.
- Real-Time Collaboration: Multiple architects viewing and editing the diagram simultaneously as code changes.
These advancements will further reduce the gap between code and documentation, making the package diagram an integral part of the development experience rather than a separate activity.
Conclusion 🏁
The package diagram remains a vital tool for software architects and developers, even as the industry moves toward more agile and automated workflows. Its relevance lies in its ability to simplify complexity and communicate structure. However, the method of creation and maintenance must evolve. Relying on static, manually drawn diagrams is no longer sustainable in a DevOps environment.
By embracing automation, integrating diagram validation into CI/CD pipelines, and focusing on metrics rather than just visuals, teams can ensure their architecture documentation remains accurate and useful. The goal is not to create perfect drawings, but to maintain a clear understanding of the system’s structure. This understanding enables better decision-making, faster troubleshooting, and more resilient systems. As technology continues to advance, the package diagram will continue to adapt, serving as a bridge between human intent and machine execution.