Now Reading: From Scope to Visual Logic: Mastering Use Cases, Descriptions, and Activity Diagrams
-
01
From Scope to Visual Logic: Mastering Use Cases, Descriptions, and Activity Diagrams


From Scope to Visual Logic: Mastering Use Cases, Descriptions, and Activity Diagrams
In the complex landscape of requirements engineering and UML (Unified Modeling Language) modeling, clarity is paramount. Three specific artifacts form a tightly interconnected trio that ensures this clarity: the Use Case, the Use Case Description, and the Activity Diagram. While often treated as separate documentation tasks, these elements are designed to complement one another, creating a refinement ladder that progresses from high-level scope to detailed textual narrative, and finally to precise visual behavioral flow.
This progression is not merely a documentation exercise; it is a powerful discovery mechanism. By moving through these stages, business analysts and system architects can uncover hidden requirements, intricate business logic, and system constraints that might otherwise remain overlooked until the testing or development phases.

The Three Pillars of System Behavior
To understand how these elements interact, we must first define their individual roles within the system specification process.
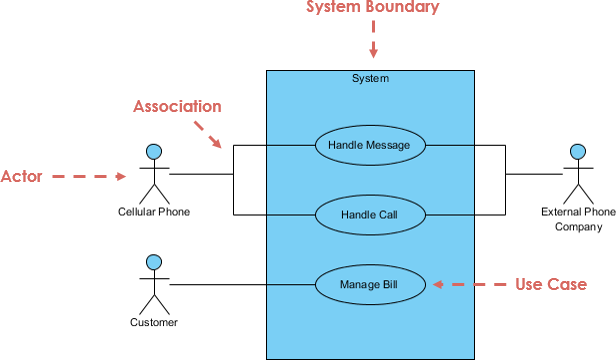
1. The Use Case
The Use Case is the fundamental unit of scope. It represents a single, named unit of functionality that delivers observable value to an actor, whether that actor is a human user or an external system. It answers the high-level question: “What goal does the actor achieve?”
Common examples include “Withdraw Cash,” “Place Online Order,” or “Generate Monthly Report.” At this stage, the focus is strictly on the boundary of the system and the primary goals.
2. The Use Case Description
Also known as a scenario or specification, the Use Case Description bridges the gap between an abstract title and concrete behavior. It is a structured textual narrative that explains how the goal is achieved. A robust description typically includes:
- Preconditions: What must be true before the process starts.
- Main Success Scenario: The “happy path” or basic flow of events.
- Alternative Flows: Variations in the path that still lead to success.
- Exception Flows: Error conditions and how they are handled.
- Postconditions: The state of the system after completion.
3. The Activity Diagram
The Activity Diagram brings the text to life visually. It is a UML behavioral diagram that maps out the step-by-step workflow, identifying control flows, decision points, parallelism, and object flows. Unlike the linear nature of text, an activity diagram can easily represent complex logic using actions, decision nodes, forks, joins, and swimlanes to designate responsibilities.
The Natural Progression: Scope to Narrative to Visual
In practice, these artifacts are rarely created in isolation. They follow a natural, almost evolutionary chain of development:
- Identify Use Cases: Establish the scope and goals.
- Write Descriptions: Draft the narrative scenarios.
- Draw Activity Diagrams: Formalize the logic visually.
A Use Case by itself is too abstract. While the textual description adds necessary detail, prose is inherently linear. It is difficult to scan a paragraph of text and immediately grasp complex branching logic, concurrency, or infinite loops. The Activity Diagram visualizes this description, making the flow explicit and significantly easier to analyze. This transformation is so logical that many modern modeling tools support semi-automatic generation of diagrams from structured text.
The “Requirements Magnifier” Effect
The transition from a textual description to an activity diagram effectively acts as a requirements magnifier. When an analyst attempts to draw a line from one action to another, they are forced to answer detailed “what if” and “how exactly” questions.
This iterative refinement helps discover:
- Missing Logic: Gaps in preconditions or undefined postconditions.
- Concurrency Needs: Processes that can or must happen simultaneously (e.g., sending an email while updating a database).
- Edge Cases: Hidden alternative paths that text descriptions glossed over.
- Business Rules: Specific validations required at decision nodes.
- Data Dependencies: Object flows that dictate required input data.
It is not uncommon for the creation of an activity diagram to reveal 20% to 50% more detailed requirements than the initial textual description contained. Stakeholders spot inconsistencies, developers identify ambiguities, and testers find testable conditions that were previously invisible.
Concrete Examples of Discovery
To illustrate the power of this progression, let us examine how specific diagrams uncover details in common scenarios.
Example 1: ATM – Withdraw Cash
The Use Case: A cardholder wants to withdraw cash.
The Textual Description: The user inserts a card, enters a PIN, selects an amount, and receives cash. Exceptions include insufficient funds or a wrong PIN.
What the Activity Diagram Uncovers:
- Looping Logic: What happens after the first wrong PIN? The diagram requires a loop back to the PIN entry with a counter. This reveals the requirement for a “lock card after 3 attempts” rule.
- Sequencing: Does the system check the account balance before or after checking the physical cash availability in the ATM?
- Interruptibility: Can the user cancel the transaction after entering the amount but before the cash dispenses? This requires a “Cancel” action node.
Example 2: Online Shopping – Place Order
The Use Case: A customer places an order.
The Textual Description: The user browses, adds items to a cart, checks out, pays, and receives confirmation.
What the Activity Diagram Uncovers:
- Parallel Processing (Forks/Joins): Once the order is confirmed, the system needs to send an email, update inventory, and initiate a shipping request. The diagram shows these as parallel flows.
- Inventory Logic: A decision node asks, “Is the item in stock?” If not, a new flow for “Backorder” or “Notify User” is discovered.
- Swimlanes: By visually separating the Customer, System, Payment Provider, and Warehouse, the diagram clarifies interface requirements between external APIs and internal systems.
Example 3: Library System – Borrow Book
The Use Case: A member borrows a book.
The Textual Description: Member requests a book; librarian checks status and issues the book.
What the Activity Diagram Uncovers:
- Sub-processes: A decision node checks for overdue fines. If fines exist, the flow diverts to a “Pay Fine” sub-process before returning to the main flow.
- Complex Constraints: A check for “Maximum books per member” reveals a business rule that was likely missing from the initial text.
- Reservation Queues: If the book is reserved by another member, the flow must diverge to a waitlist or rejection path.
Example 4: Hospital – Schedule Appointment
The Use Case: A patient schedules a visit.
The Textual Description: Patient selects a slot, confirms insurance, and books the appointment.
What the Activity Diagram Uncovers:
- Concurrency: The system must simultaneously check doctor availability and room availability to prevent double-booking resources.
- Exception Handling: What happens if the doctor cancels later? The diagram reveals the need for a rescheduling or notification workflow.
- Decision Trees: The logic for insurance verification becomes a complex tree: Is it covered? If no, is there a self-pay option? If no, cancel the process.
Key AI Tools in Visual Paradigm Relevant to This Flow
Visual Paradigm integrates several purpose-built AI apps (accessible via “Create with AI”, Tools > Apps, or the AI toolbox in both Online and desktop editions):
- AI Use Case Description Generator — Starts from a short prompt and produces a structured use case description.
- AI Use Case Diagram Refinement Tool — Generates or refines use case diagrams with proper include / extend relationships.
- Use Case to Activity Diagram app — The star feature for our flow: directly converts a use case (with its description) into a full UML activity diagram.
- Supporting tools like AI Use Case Scenario Analyzer, Base Use Case Diagram Analyzer, and the conversational AI Chatbot for iterative refinement.
These tools form an integrated pipeline that supercharges the traditional refinement ladder.
How Visual Paradigm AI Supports and Improves Each Step
- Starting Point: From Idea/Prompt to Use Case + Description
- Input a brief natural-language prompt (e.g., “ATM cash withdrawal system” or “Online bookstore order placement”).
- The AI Use Case Description Generator produces:
- A problem/system overview paragraph (editable)
- Structured elements: preconditions, postconditions, main success scenario, alternative flows, exceptions
- Often suggests related actors and goals
- Benefit: Jumps over blank-page syndrome and ensures a consistent, complete textual baseline faster than manual writing.
- Discovery effect: AI often adds realistic alternatives/exceptions (e.g., “network failure during payment”) that prompt users to confirm or expand requirements early.
- Visualizing Scope: Use Case Diagram (Optional but Helpful)
- From the description or prompt, use the AI Use Case Diagram Refinement Tool to auto-generate actors, use cases, and relationships.
- AI analyzes the text and suggests include (shared sub-goals like “Authenticate User”) and extend (conditional extensions like “Apply Discount → only if promo code valid”).
- You preview, export SVG, or open in the full editor for tweaks.
- Benefit: Provides a quick “big picture” before diving into details, helping spot missing actors or overlapping functionalities.
- The Core Leap: Use Case Description → Activity Diagram
- In the Use Case to Activity Diagram app:
- Provide/use the use case name, actors, summary, and (ideally) the full description generated earlier.
- Click “Generate details with AI” → AI expands/fills in missing parts (pre/postconditions, flows).
- Then generate the diagram instantly.
- The resulting activity diagram includes:
- Actions/steps from the main flow
- Decision nodes for branches (e.g., “PIN correct?”)
- Forks/joins for parallel actions (e.g., dispense cash + send receipt + update balance)
- Swimlanes when multiple actors/system parts are involved
- Exception paths and loops (e.g., 3× wrong PIN → retain card)
- Benefit: Turns linear text into a precise, inspectable UML activity diagram in seconds — the same transformation that traditionally reveals the most hidden logic.
- In the Use Case to Activity Diagram app:
How This AI-Accelerated Flow Helps Discover More Detailed Requirements and Logic
The AI doesn’t just speed things up; it acts as an intelligent “requirements amplifier” by:
- Filling gaps automatically — AI infers plausible alternatives/exceptions (e.g., “low ATM cash” or “inventory reserved but payment fails”) → forces you to validate or add rules.
- Enforcing structure & UML best practices — Suggests modular flows via include/extend → uncovers reusable logic and reduces redundancy.
- Highlighting concurrency & dependencies — Activity diagrams show parallelism (forks) and synchronization (joins) → reveals timing, performance, or integration needs (e.g., “update inventory AND email customer” must both succeed).
- Iterative refinement loop — Use the AI Chatbot (“Add exception for fraud check” or “Show swimlanes for payment gateway”) or re-generate after edits → each iteration surfaces new questions.
- Generating reports & test cases — Many tools auto-produce flow summaries, decision tables, or test scenarios → exposes edge cases for validation.
Concrete Examples with Visual Paradigm AI
- ATM Withdraw Cash
- Prompt: “ATM cash withdrawal”
- AI generates description with main flow + alternatives (insufficient funds, wrong PIN).
- Use Case to Activity Diagram → produces diagram with PIN retry loop (counter), decision for balance check before dispense, parallel update account + print receipt.
- Discovery: AI suggests “Check daily limit” branch → uncovers a new business rule.
- Online Shopping – Place Order
- AI description includes stock check, payment options.
- Activity diagram shows fork: “Process payment” parallel to “Reserve inventory”.
- Decision nodes for “In stock? → No: notify / backorder”.
- Discovery: AI adds “Fraud verification” step → triggers discussion on third-party service integration.
- Library Borrow Book
- AI detects shared “Check membership status” → suggests include relationship.
- Activity diagram visualizes fine payment sub-flow as interruptible region.
- Discovery: AI proposes “Reservation queue” exception → reveals waitlist logic requirement.
In practice, teams using these tools report 50–80% faster progression from high-level idea to detailed, visual logic — with fewer missed requirements because the AI prompts consideration of branches, concurrency, and exceptions that manual text descriptions often skip.
Summary
The journey from Use Case to Description to Activity Diagram is a proven methodology for ensuring comprehensive system specifications. The use case defines the what, the description narrates the how in words, and the activity diagram formalizes the how in visual logic.
While it may be tempting to stop at the textual description, doing so often leaves critical business rules and edge cases undefined. By forcing the requirements through the rigorous logic of a visual diagram, teams can systematically expose gaps, validate logic, and dramatically improve the quality and testability of the final software product.
Visual Paradigm’s Use Case AI Studio (particularly the Description Generator + Use Case to Activity Diagram app) transforms the classic use case → description → activity diagram flow from a slow, error-prone manual process into a fast, intelligent, iterative one. It not only saves time but actively helps uncover deeper system requirements, hidden edge cases, business rules, and behavioral logic — exactly where the biggest value of this modeling progression lies. For anyone doing requirements engineering, UML modeling, or agile user-story elaboration, these AI features make the refinement ladder far more powerful and practical in 2026.

