Strategic planning requires clarity. However, clarity often fades when analyzing complex market structures. Porter’s Five Forces framework remains a cornerstone for understanding competitive intensity. Yet, practitioners frequently stumble on implementation details. This guide addresses the specific pitfalls that undermine strategic insights. We move beyond the theory to examine practical failures and their remedies.
Many organizations treat this analysis as a one-time exercise. They produce a static snapshot that quickly becomes obsolete. The goal is not just to complete the assessment but to ensure the data reflects current realities. We will explore where the model breaks down and how to correct those errors. This approach ensures your strategy rests on solid ground.
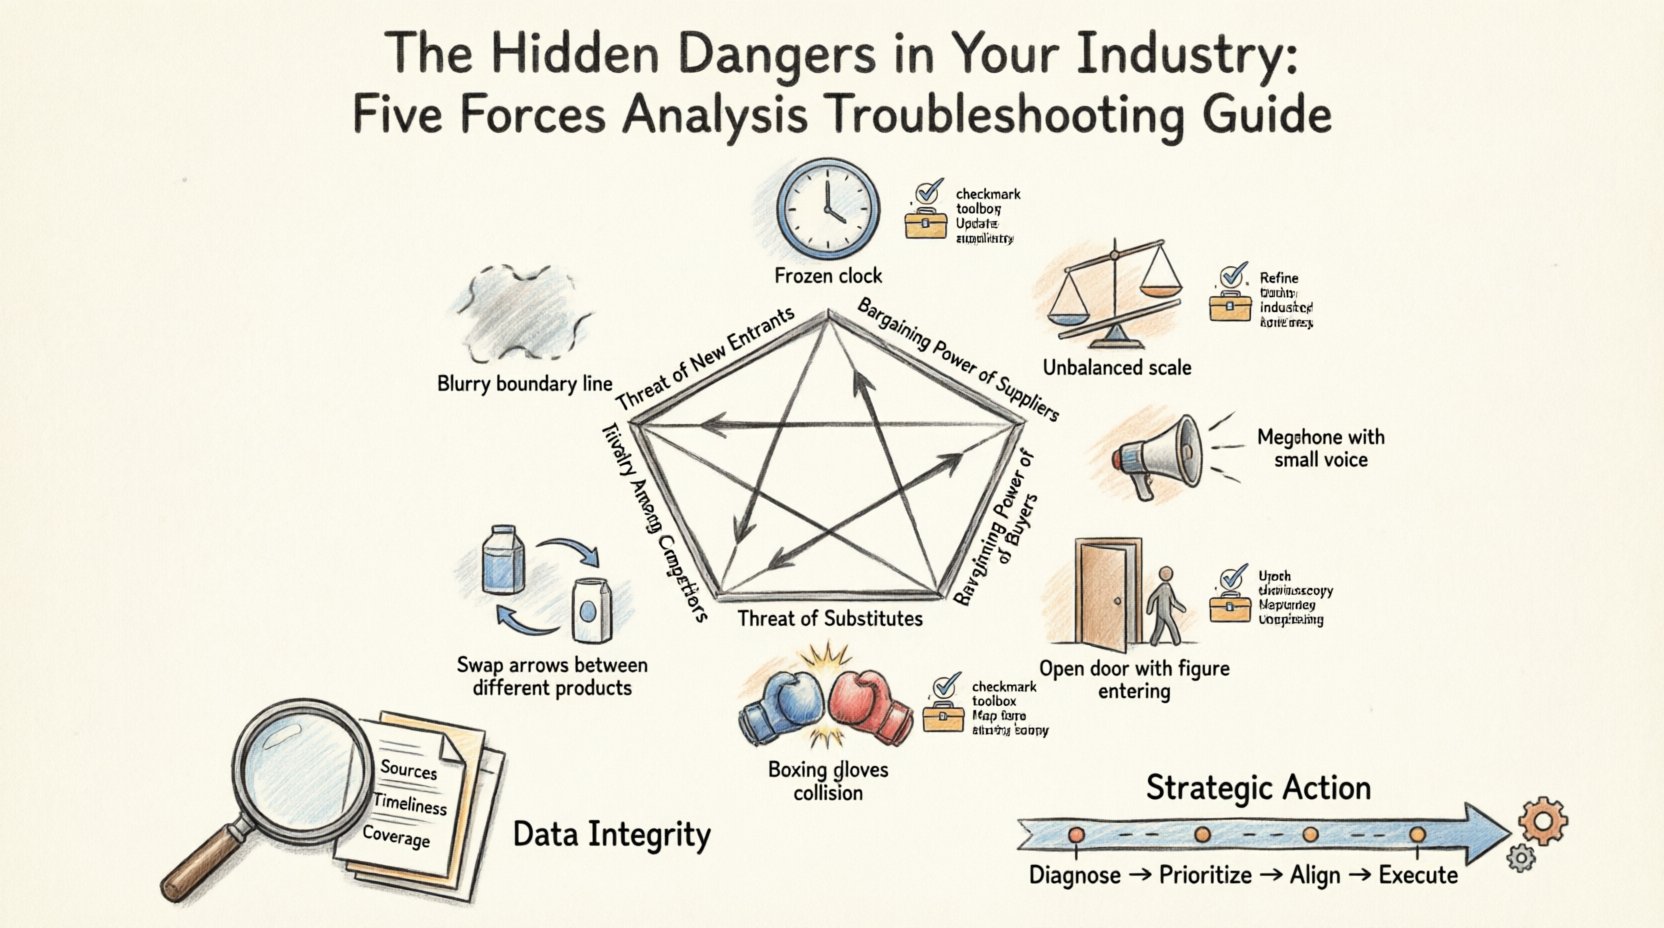
🔍 Understanding the Framework and Its Limits
Before troubleshooting, we must define the scope. The model identifies five specific forces that shape industry profitability. These are not arbitrary categories but structural determinants of competition.
- Threat of New Entrants: The ease with which new competitors can enter the market.
- Bargaining Power of Suppliers: The ability of suppliers to drive up prices.
- Bargaining Power of Buyers: The ability of customers to drive down prices.
- Threat of Substitute Products: The likelihood of customers switching to alternatives.
- Rivalry Among Existing Competitors: The intensity of competition between current players.
When these forces are strong, industry profitability is suppressed. When weak, profitability is higher. However, applying this logic requires precision. A single error in classification can skew the entire strategic outlook.
⚠️ Danger 1: Misdefining the Industry Boundary
The most common error occurs at the outset. Analysts often define the industry too narrowly or too broadly. If the boundary is too narrow, significant competitors are missed. If it is too broad, the analysis becomes diluted by unrelated market forces.
🛑 Symptoms of Boundary Errors
- Missing key competitors who operate in adjacent spaces.
- Failing to identify substitutes that serve the same underlying need.
- Overestimating barriers to entry because the scope is confused.
🛠️ Troubleshooting Steps
- Focus on Substitution, Not Just Product: Define the industry by the need it satisfies, not just the product. For example, a coffee shop is not just competing with other coffee shops. It competes with tea, energy drinks, and breakfast solutions.
- Analyze Customer Behavior: Look at what customers actually buy. If they switch easily between your product and another, they belong in the same competitive set.
- Review Market Data: Utilize external data sources to see where the majority of revenue is generated.
| Incorrect Definition | Correct Definition | Risk |
|---|---|---|
| Smartphone Makers Only | Mobile Communication Devices | Misses tablet and laptop competition |
| Fast Food Chains | Quick Service Dining | Misses grocery ready-meals |
| Banking Institutions | Payment and Lending Services | Misses fintech and crypto |
📉 Danger 2: Static Analysis in Dynamic Markets
Industries evolve. A static snapshot taken today may be irrelevant in six months. Relying on historical data without accounting for trends is a critical flaw. This is particularly true in technology and regulated sectors.
🛑 Symptoms of Static Thinking
- Barriers to entry appear higher than they actually are due to recent tech shifts.
- Supplier power is underestimated because of emerging alternatives.
- Competitive rivalry is viewed as constant, ignoring consolidation trends.
🛠️ Troubleshooting Steps
- Conduct Trend Analysis: Do not just look at current numbers. Look at the trajectory. Is supplier concentration increasing or decreasing?
- Identify Disruptive Technologies: What could render the current business model obsolete? Integrate this into the “Threat of Substitutes” section.
- Set Review Intervals: Treat the analysis as a living document. Schedule quarterly reviews to update data points.
- Scenario Planning: Create best-case and worst-case scenarios for each force to understand volatility.
💰 Danger 3: Misjudging Supplier Power
Supplier power is often misunderstood. It is not just about the number of suppliers. It is about switching costs, uniqueness of inputs, and forward integration threats.
🛑 Common Pitfalls
- Assuming that having multiple suppliers means low power.
- Ignoring the cost of switching suppliers (training, retooling, compatibility).
- Overlooking the supplier’s ability to produce the final product themselves.
🛠️ Troubleshooting Steps
- Calculate Switching Costs: Quantify the financial and operational cost of changing vendors. High switching costs equate to high supplier power.
- Assess Input Differentiation: Are the raw materials commoditized or specialized? Specialized inputs increase power.
- Monitor Supplier Concentration: Even with many small suppliers, if one holds a critical patent, their power is high.
- Evaluate Backward Integration: Check if major suppliers have acquired companies downstream. This signals a threat.
🛒 Danger 4: Underestimating Buyer Power
Buyers are not monolithic. A single large buyer has more power than many small ones. Failing to segment the customer base leads to inaccurate power assessments.
🛑 Common Pitfalls
- Assuming all customers have equal pricing leverage.
- Ignoring the transparency of information available to buyers.
- Overlooking the impact of switching costs for the buyer.
🛠️ Troubleshooting Steps
- Segment the Customer Base: Distinguish between individual consumers, mid-sized businesses, and enterprise clients. Enterprise clients usually hold more power.
- Analyze Price Sensitivity: Determine how much volume changes with price adjustments. High elasticity suggests high buyer power.
- Check Information Availability: Can buyers easily compare prices and quality? Digital marketplaces increase buyer power significantly.
- Review Product Differentiation: If your product is unique, buyer power is lower. If it is a commodity, buyer power is higher.
🚪 Danger 5: Overlooking New Entrants
Barriers to entry are the primary defense against new competition. However, these barriers are not permanent. Technology, regulation, and capital requirements change over time.
🛑 Common Pitfalls
- Assuming high capital requirements stop all new players.
- Neglecting regulatory changes that lower entry barriers.
- Ignoring niche players who start small and scale.
🛠️ Troubleshooting Steps
- Map Regulatory Landscapes: Watch for deregulation or policy shifts that lower entry hurdles.
- Identify Capital Gaps: Is technology making it cheaper to enter? Cloud computing, for example, has lowered entry costs for software.
- Monitor Niche Innovators: New entrants often start in a niche where incumbents are weak. Do not ignore small players.
- Assess Distribution Channels: If a new entrant can bypass traditional distribution (e.g., direct-to-consumer), barriers are lower.
🔄 Danger 6: Ignoring Substitutes
Substitutes are often the biggest threat to profitability. They do not have to be the same product to serve the same function. This force is frequently confused with “new entrants”.
🛑 Common Pitfalls
- Focusing only on direct product competitors.
- Ignoring the price-performance trade-off of alternatives.
- Undervaluing the convenience factor of substitutes.
🛠️ Troubleshooting Steps
- Define the Job-to-be-Done: What problem is the customer solving? Any solution that solves it is a substitute.
- Compare Relative Prices: If a substitute is cheaper and “good enough,” it poses a threat.
- Monitor Cross-Industry Innovation: Look at industries outside your own for new technologies that solve your core problem.
- Track Switching Rates: Measure how often customers leave your product for a completely different category.
🥊 Danger 7: Miscalculating Rivalry
Rivalry is the most visible force. It is easy to count competitors, but hard to measure intensity. Price wars, advertising battles, and innovation races all signal high rivalry.
🛑 Common Pitfalls
- Counting only direct competitors.
- Ignoring capacity constraints as a driver of rivalry.
- Overlooking exit barriers that trap competitors in the market.
🛠️ Troubleshooting Steps
- Analyze Industry Growth: In slow-growth industries, firms fight for market share, increasing rivalry. In high growth, they focus on expansion.
- Check Exit Barriers: If competitors cannot leave easily (due to sunk costs), they will fight harder to stay. This drives rivalry up.
- Evaluate Homogeneity: If products are identical, competition moves to price. Differentiation reduces rivalry intensity.
- Monitor Asset Specificity: Highly specialized assets make exit difficult, increasing the likelihood of aggressive competition.
📊 Data Integrity and Sourcing Issues
The quality of the analysis depends entirely on the quality of the data. Relying on anecdotal evidence or outdated reports leads to flawed conclusions. Accuracy is paramount.
🛠️ Troubleshooting Steps
- Triangulate Data Sources: Do not rely on a single report. Cross-reference financial filings, industry news, and direct interviews.
- Verify Internal Metrics: Ensure internal sales data aligns with external market reports. Discrepancies often indicate blind spots.
- Engage Frontline Staff: Sales and customer service teams often know market shifts before data reflects them. Gather their input.
- Use Primary Research: Where possible, conduct surveys or interviews to validate assumptions about buyer and supplier behavior.
| Data Source | Reliability | Best Used For |
|---|---|---|
| Financial Filings | High | Competitor revenue and cost structures |
| Industry Reports | Medium | Market size and growth trends |
| Customer Interviews | High (Qualitative) | Buyer power and switching reasons |
| Supplier Contracts | High | Supplier dependency and terms |
🎯 Strategic Application and Action
Once the analysis is complete, the data must translate into action. A report that sits on a shelf provides no value. The output should inform resource allocation and risk management.
🛠️ Implementation Checklist
- Identify Key Risks: Which force poses the greatest threat to margins?
- Develop Mitigation Strategies: How can you reduce supplier power or increase switching costs?
- Align Budgets: Direct investment toward areas that strengthen weak forces.
- Monitor Triggers: Set up alerts for changes in the forces (e.g., a new regulation).
- Train Leadership: Ensure decision-makers understand the framework and the specific findings.
🔗 Conclusion
A Five Forces analysis is a tool for diagnosis, not a crystal ball. It reveals the structural health of an industry. When executed correctly, it highlights vulnerabilities before they become crises. When executed poorly, it creates a false sense of security.
By avoiding the common dangers outlined in this guide, you ensure that your strategic planning is grounded in reality. Focus on dynamic data, accurate boundaries, and deep understanding of the forces at play. This disciplined approach leads to sustainable competitive advantage.
Remember that the market is fluid. What holds true today may shift tomorrow. Continuous monitoring is the only way to maintain clarity in a complex environment. Use this troubleshooting guide as a reference whenever you revisit your strategic assumptions.