The artificial intelligence revolution in visual modeling is reshaping how engineers, architects, and analysts create diagrams. However, the market landscape presents a stark dichotomy. On one side, we have a proliferation of standalone Generative AI Chatbots and niche diagram plugins that offer impressive initial results but lack depth, context, and control. On the other side, Visual Paradigm has deployed a four-pillar ecosystem designed not just to generate a diagram, but to manage, trace, and produce professional-grade models from conception to deployment.
Here is a detailed feature review comparing the limitations of isolated tools against the comprehensive capabilities of Visual Paradigm’s four platforms.
The Limitation of the Status Quo: Isolated AI vs. Generic LLMs
Most competing solutions currently operate in one of two constrained modes, both of which struggle with the complexity of enterprise-grade modeling:
1. The “Blank Canvas” Chatbot Trap
Many popular AI diagram generators operate as single-purpose chatbots. Users describe a need in natural language (e.g., “Draw a class diagram for a banking system”), and the AI outputs an image or code.
-
The Problem: These tools are excellent for “first drafts” but terrible for iteration. Once generated, the diagram is often a static image or unlinked code. If you ask the AI to “move this class” or “add an interface dependency,” the tool often hallucinates or requires starting over.
-
Lack of Traceability: There is no link between the generated diagram, the underlying data model, or the source code. If a requirement changes, the model cannot be updated automatically.
-
No Professional Control: Users lose the granular editing capabilities required for UML 2.5 compliance, Stereotypes, or complex SysML constraints because the focus is on the prompt-to-image pipeline, not the engineering workflow.
2. The Siloed Tool Fragmentation
Many organizations try to piece together their AI toolkit: using ChatGPT or Midjourney for ideas, PlantUML for generation, Lucidchart for styling, and Excel for documentation.
-
The Problem: This “tool sprawl” creates information islands. A sequence diagram generated in PlantUML is disconnected from the class diagram in the database tool.
-
Workflow Disruption: Teams waste hours copying and pasting artifacts between platforms. There is no central truth source, leading to version control nightmares and inconsistent modeling standards.
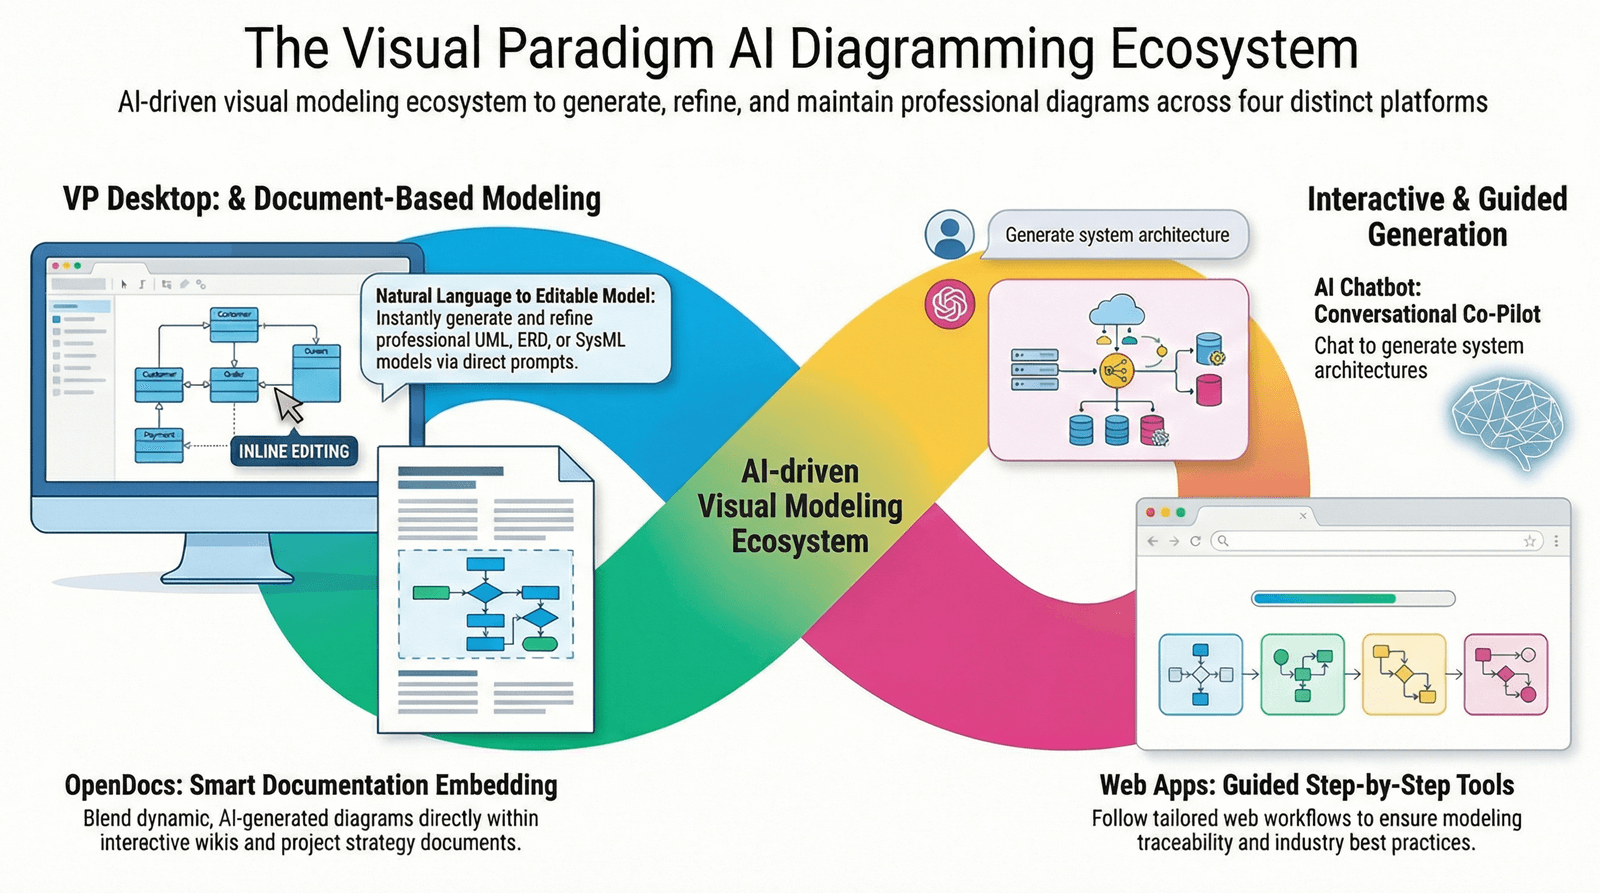
Visual Paradigm’s Four-Pillar Ecosystem: A Complete Lifecycle Approach
Visual Paradigm addresses these fragmentation issues by integrating AI directly into four distinct but interconnected platforms. This structure supports every stage of the modeling lifecycle, ensuring that AI accelerates creation while Human Control ensures quality.
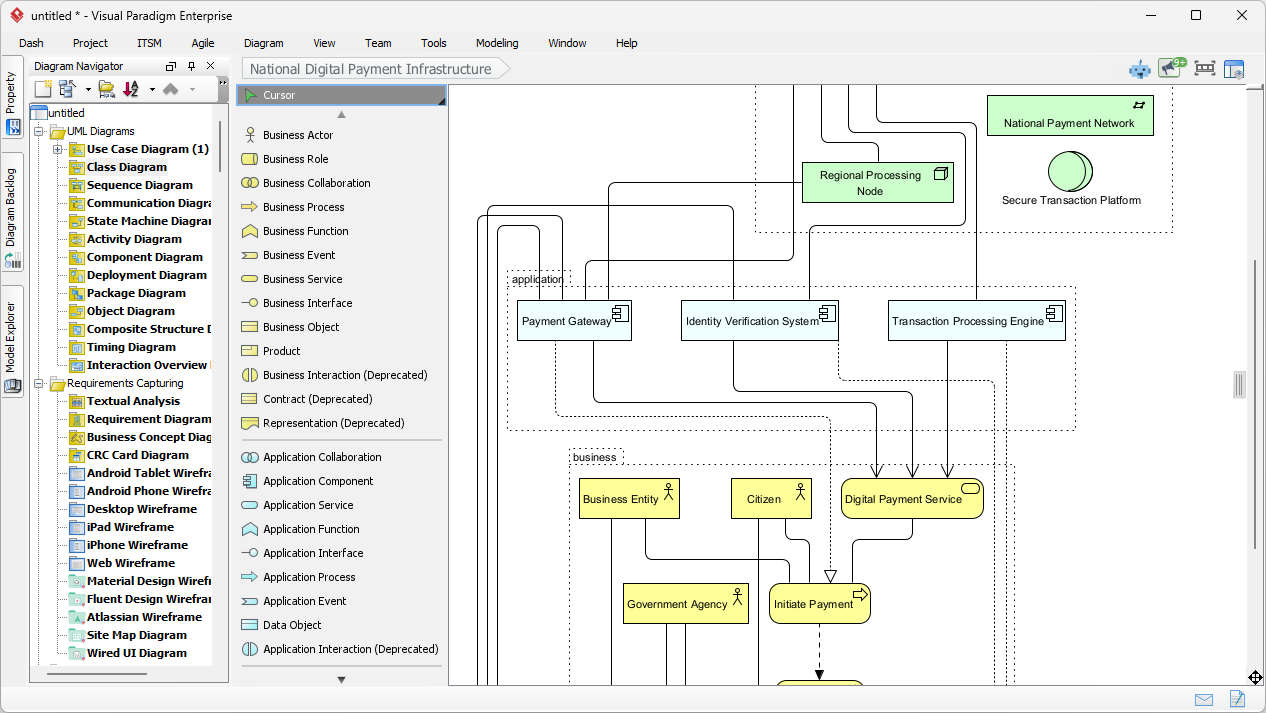
1. VP Desktop (Visual Model): The Engine of Precision
-
What it is: The flagship desktop application, combining traditional vector-based modeling with embedded AI.
-
The Value: Unlike chatbots, VP Desktop prioritizes post-generation refinement. It allows users to generate a model and then perform surgical edits (changing associations, applying constraints, UML standard compliance) without breaking the structure.
-
Unique Capability: It manages the linkage of artifacts. If you change a Class in the Class Diagram, the Sequence Diagrams referencing that class can be updated or validated against the history. It supports full UML 2.5 and SysML 1.3 compliance.
-
Ideal For: Serious architects building complex, production-ready models where accuracy and traceability are non-negotiable.
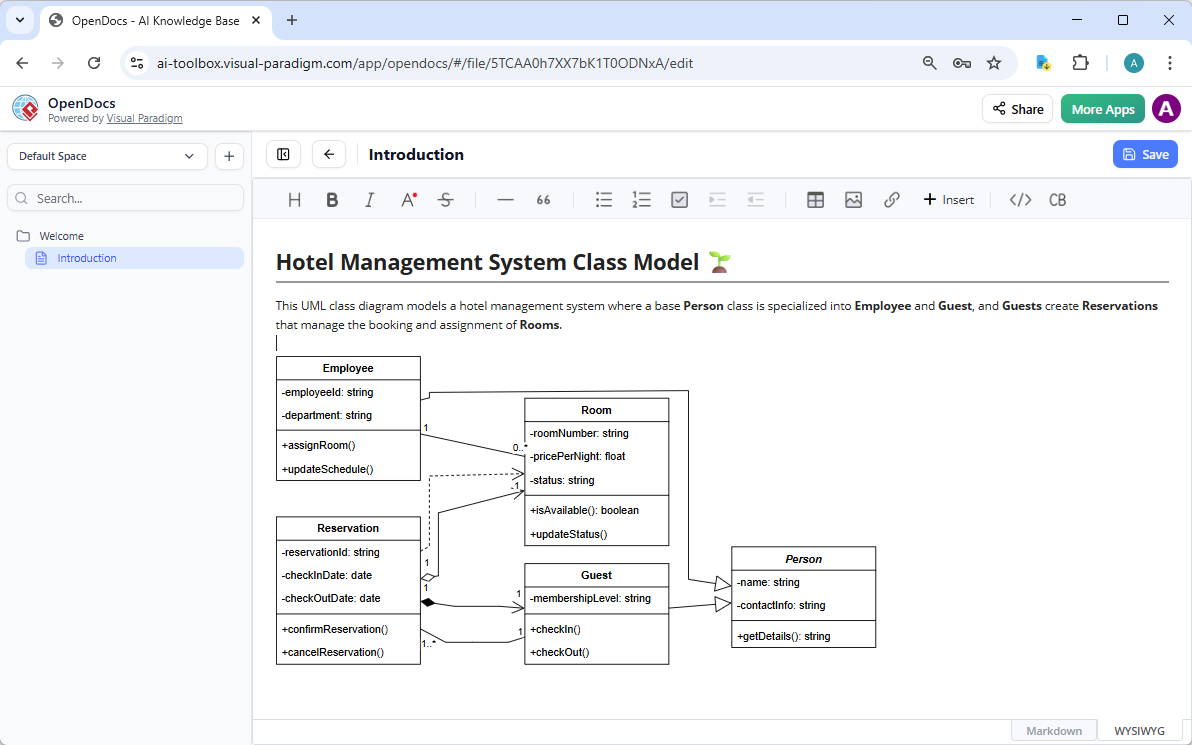
2. OpenDocs: The Dynamic Knowledge Hub
-
What it is: A document-centric platform where diagrams live inline with text, similar to advanced Notion or GitBook, but with live, editable visualizations.
-
The Value: Most tools force a choice: either a high-fidelity diagram or a readable document. OpenDocs bridges this gap. You can embed a Class Diagram directly into a strategy document, and when you edit the diagram in the sidebar, the document updates instantly.
-
Unique Capability: Living Documentation. It prevents the “diagram graveyard” where diagrams become outdated. It fosters team alignment by allowing colleagues to comment directly on specific elements within the narrative context.
-
Ideal For: Creating wikis, strategy guides, and requirement specifications where the visual must remain synchronized with the text.
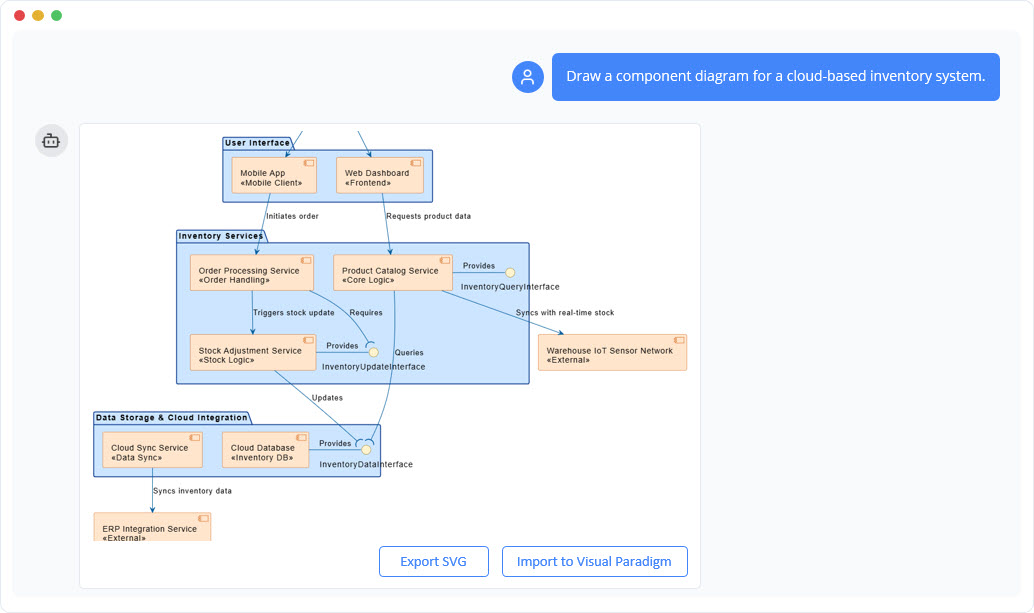
3. AI Visual Modeling Chatbot: The Generative Co-Pilot
-
What it is: A conversational AI assistant that acts as a “blueprinting tool.”
-
The Value: Using natural language, users can generate entire subsystems, flowcharts, or interaction diagrams from text descriptions. It excels at overcoming the “blank canvas” problem and rapid prototyping.
-
Unique Capability: Iterative Dialogue. Unlike a one-shot generator, this tool allows for follow-up questions (“Move Actor A to the top,” “Convert this to state transitions”). Crucially, when connected to the Desktop, it pushes the result into a professional, editable file.
-
Ideal For: Agile teams, brainstorming sessions, and rapid prototyping.
4. Web Apps Step-by-Step (Guided Studios): The Structured Enforcer
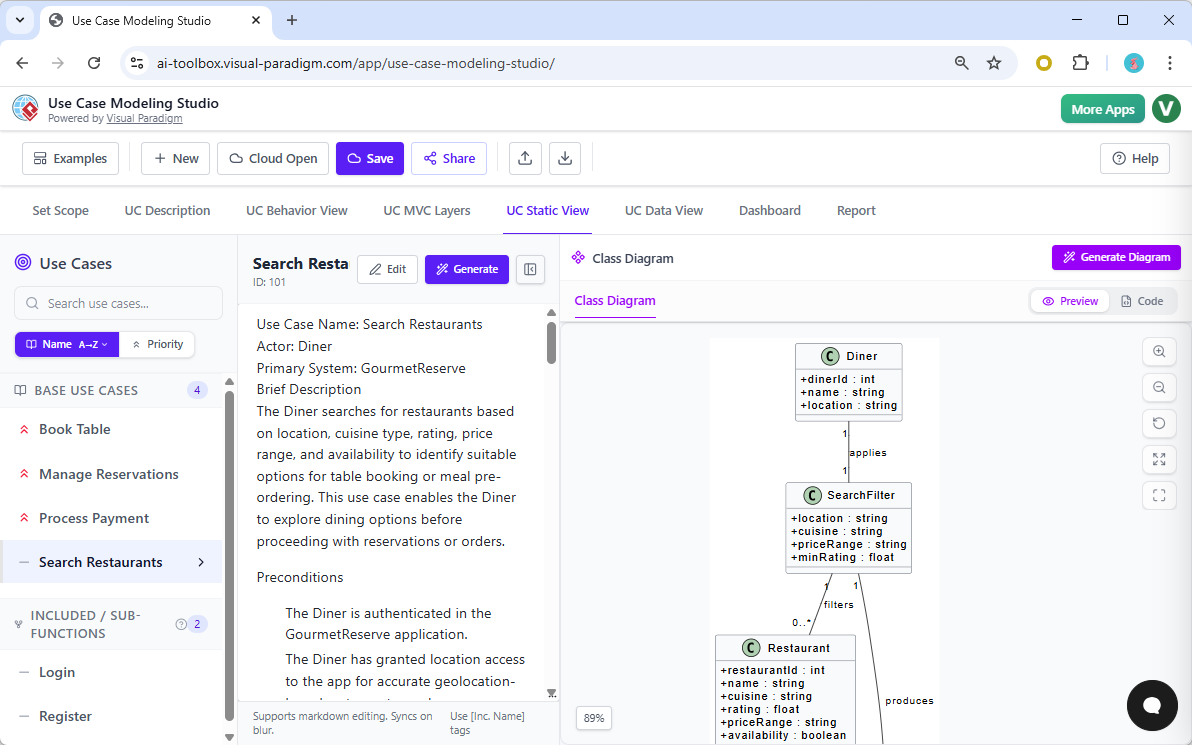
-
What it is: Specialized browser-based assistants for specific workflows (e.g., C4 PlantUML Studio, Use Case Modeling Studio).
-
The Value: AI works best when guided by strict methodologies. These tools enforce best practices by breaking complex tasks into linear steps.
-
Unique Capability: Traceability Enforcement. These studios ensure models are interconnected (e.g., generating Use Cases automatically leads to Activity Diagrams). It prevents the “spaghetti model” problem.
-
Ideal For: Methodical projects requiring adherence to specific frameworks like C4 or DOORS.
Comparative Analysis: The Matrix of Capability
The true differentiator lies in the breadth and depth of support. While other tools might offer one “magic button,” Visual Paradigm provides a matrix where specific diagrams are supported differently depending on the phase of the project.
1. General Comparison: General LLMs/Isolated Tools vs. Visual Paradigm
| Feature Dimension | Generic LLMs / Isolated Tools | Visual Paradigm (4-Pillar Ecosystem) |
|---|---|---|
| Output Format | Often static images (PNG/JPG) or raw code snippets. | Editable, vector-based, compliant UML/SysML diagrams. |
| Traceability | None. Changes require regeneration. | Full Traceability. Links between requirements, models, and code. |
| Refinement | Difficult; often requires re-prompting entirely. | Seamless Post-Generation Editing. Change properties, stereotypes, and associations immediately. |
| Workflow | Linear (Prompt → Result). | Cyclical. Generate → Refine → Validate → Embed → Link. |
| Collaboration | Siloed; hard to version control. | Integrated. Works within team wikis (OpenDocs) and VCS (Desktop). |
| Compliance | Guesswork on standards. | Strict Adherence to UML 2.5, SysML 1.3, ArchiMate 3.0. |
2. UML & SysML Diagram Support Matrix
Legend: 🖥 Desktop (Precision), 📖 OpenDocs (Embedded Docs), 🤖 Chatbot (Rapid Gen), 🌐 Web Apps (Guided Studios)
| Diagram Type | 🖥 VP Desktop | 📖 OpenDocs | 🤖 Chatbot | 🌐 Web Apps | Key Capability |
|---|---|---|---|---|---|
| Use Case | ✅ | ✅ | ✅ | ✅ | Full lifecycle: Use Case → Activity → DB Model |
| Class | ✅ | ✅ | ✅ | ✅ | AI-Assisted generation + Refinement |
| Sequence | ✅ | ✅ | ✅ | Partial | Fast generation + Linkage to Use Cases |
| Communication | ✅ | ❌ | ❌ | ❌ | Deep interaction modeling in Desktop |
| Activity | ✅ | ✅ | ✅ | ✅ | Derived from Use Cases; Step-by-step |
| State Machine | ✅ | ✅ | ✅ | ❌ | Complex state logic refinement |
| Deployment | ✅ | ✅ | ✅ | ❌ | Infrastructure topology modeling |
| Component | ✅ | ✅ | ✅ | ❌ | Architectural view generation |
| Object | ✅ | ✅ | ✅ | ❌ | Object instance interaction |
| Timing | ✅ | ❌ | ❌ | ❌ | Real-time system constraints |
| Package | ✅ | ✅ | ✅ | ❌ | Modular structure definition |
| Composite Structure | Limited | ✅ | ✅ | ❌ | Internal system structure |
| Profile | Limited | ✅ | ❌ | ❌ | Stereotype definition |
| SysML Req. Diagnosis | ✅ | ✅ | ✅ | ❌ | Requirement traceability |
| SysML Internal Block | ✅ | ✅ | ✅ | ❌ | System component architecture |
| SysML Block Def. | ✅ | ✅ | ✅ | ❌ | System definition modeling |
| SysML Parametric | Limited | ✅ | ❌ | ❌ | Constraint & performance analysis |
3. C4 Model & Architecture Support Matrix
Legend: 🖥 Desktop, 📖 OpenDocs, 🤖 Chatbot, 🌐 Web Apps
| C4 Layer | 🖥 VP Desktop | 📖 OpenDocs | 🤖 Chatbot | 🌐 Web Apps | Key Capability |
|---|---|---|---|---|---|
| System Context | ✅ | ❌ | ✅ | ✅ | Introductory overview (3 levels) |
| Container | ✅ | ❌ | ✅ | ✅ | High-level logic & containers |
| Component | ✅ | ❌ | ✅ | ✅ | Internal object/data structure |
| System Landscape | ✅ | ❌ | ❌ | ✅ | Full infrastructure topology |
| Dynamic Diagram | ✅ | ❌ | ❌ | ✅ | Arrangements of containers |
| Deployment | ✅ | ❌ | ✅ | ✅ | Physical server & network view |
4. Enterprise & Business Improvement Matrix
| Diagram Type | 🖥 VP Desktop | 📖 OpenDocs | 🤖 Chatbot | 🌐 Web Apps | Key Capability |
|---|---|---|---|---|---|
| ArchiMate (Full) | ✅ | ✅ | ✅ | ❌ | Full 3-layer (Strategy/Design/IT) |
| ArchiMate Viewpoints | ✅ | ❌ | ✅ | ❌ | Specific stakeholder views (Actor, Deliverable) |
| Conversation (BPMN) | ✅ | ❌ | ❌ | ❌ | Complex business process flows |
| Decision Table | ✅ | ❌ | ❌ | ✅ | Logic-based decisioning logic |
| Process Overview | ✅ | ❌ | ❌ | ❌ | High-level process map |
| EPC (Event Driven) | ✅ | ✅ | ❌ | ❌ | SAP-centric EPC modeling |
| Value Stream Mapping | ❌ | ❌ | ❌ | ✅ | Lean/Agile process optimization |
| Stakeholder Interaction | ❌ | ❌ | ❌ | ✅ | Organizational interaction maps |
5. Cloud Architecture Support Matrix
| Cloud Type | 🖥 VP Desktop | 📖 OpenDocs | 🤖 Chatbot | 🌐 Web Apps | Key Capability |
|---|---|---|---|---|---|
| AWS Architecture | ❌ | ✅ | ❌ | ✅ | AWS specific resource layout |
| Azure Architecture | ❌ | ❌ | ❌ | ✅ | Microsoft Azure resource layout |
| Google Cloud | ❌ | ❌ | ❌ | ✅ | GCP resource layout |
| Alibaba Cloud | ❌ | ❌ | ❌ | ✅ | Alibaba resource layout |
| Oracle Cloud | ❌ | ❌ | ❌ | ✅ | Oracle Cloud layout |
| IBM Cloud | ❌ | ✅ | ❌ | ✅ | IBM Cloud resource layout |
| Kubernetes | ❌ | ❌ | ❌ | ✅ | Container orchestration topology |
| DigitalOcean | ❌ | ❌ | ❌ | ✅ | Droplet & droplet network |
| OpenStack | ❌ | ❌ | ❌ | ✅ | Open source cloud infrastructure |
| Elastic | ❌ | ❌ | ❌ | ✅ | Elastic cloud architecture |
6. Strategic Analysis Support Matrix
| Analysis Type | 🖥 VP Desktop | 📖 OpenDocs | 🤖 Chatbot | 🌐 Web Apps | Key Capability |
|---|---|---|---|---|---|
| SWOT | 🤖/🌐 | ❌ | ✅ | ✅ | 4-Aspects Infographic |
| PEST | 🤖/🌐 | ❌ | ✅ | ✅ | 4-Aspects Infographic |
| PESTLE | 🤖/🌐 | ❌ | ✅ | ✅ | 4-Aspects Infographic |
| SOAR | 🤖/🌐 | ❌ | ✅ | ✅ | 4-Aspects Infographic |
| TOWS | 🌐 | ❌ | ✅ | ✅ | 4-Aspects Infographic |
| 5C’s | 🌐 | ❌ | ❌ | ✅ | 4-Aspects Infographic |
| Porter’s 5 Forces | 🌐 | ❌ | ❌ | ✅ | 5-Aspects Infographic |
| McKinsey 7S | 🤖/🌐 | ❌ | ✅ | ✅ | 7-Aspects Infographic |
| VRIO | 🌐 | ❌ | ❌ | ✅ | 4-Aspects Infographic |
| Johari Window | 🌐 | ❌ | ❌ | ✅ | 4-Aspects Infographic |
7. Growth & Portfolio Strategy Matrix
| Strategy Model | 🖥 VP Desktop | 📖 OpenDocs | 🤖 Chatbot | 🌐 Web Apps | Key Capability |
|---|---|---|---|---|---|
| Ansoff Matrix | 🤖/🌐 | ❌ | ✅ | ✅ | 4-Aspects Infographic |
| Blue Ocean | 🤖/🌐 | ❌ | ✅ | ✅ | 4-Aspects Infographic |
| BCG Matrix | 🌐 | ❌ | ❌ | ✅ | 4-Aspects Infographic |
| Marketing Mix (4Ps) | 🌐 | ❌ | ❌ | ✅ | 4-Aspects Infographic |
| Marketing Mix (4Cs) | 🤖 | ❌ | ✅ | ❌ | Direct Chatbot Gen |
| 7P Marketing Mix | 🌐 | ❌ | ❌ | ✅ | 7-Aspects Infographic |
| AIDA Model | 🌐 | ❌ | ❌ | ✅ | 4-Aspects Infographic |
| Balanced Scorecard | 🌐 | ❌ | ❌ | ✅ | 4-Aspects Infographic |
8. Prioritization & Execution Matrix
| Framework | 🖥 VP Desktop | 📖 OpenDocs | 🤖 Chatbot | 🌐 Web Apps | Key Capability |
|---|---|---|---|---|---|
| Eisenhower Matrix | 🤖/🌐 | ❌ | ✅ | ✅ | 4-Aspects Infographic |
| RACI Matrix | 🌐 | ❌ | ❌ | ✅ | 4-Aspects Infographic |
| Effort-Impact | 🌐 | ❌ | ❌ | ✅ | 4-Aspects Infographic |
| SMART Goals | 🌐 | ❌ | ❌ | ✅ | 5-Aspects Infographic |
| PDCA | 🌐 | ❌ | ❌ | ✅ | 4-Aspects Infographic |
| Hoshin Kanri | 🌐 | ❌ | ❌ | ✅ | 4-Aspects Infographic |
| DMAIC | 🌐 | ❌ | ❌ | ✅ | 5-Aspects Infographic |
9. General Diagrams & Data Visualization Matrix
| Diagram Type | 🖥 VP Desktop | 📖 OpenDocs | 🤖 Chatbot | 🌐 Web Apps | Key Capability |
|---|---|---|---|---|---|
| Infographic | Limited | ❌ | ❌ | ✅ | Multi-aspect Infographic Generators |
| Breakdown Structure | ✅ | ✅ | ❌ | ❌ | Hierarchical deconstruction |
| PERT Chart | ✅ | ✅ | ✅ | ❌ | Project timeline mapping |
| KPI Performance | 🌐 | ❌ | ❌ | ✅ | Data-driven performance charts |
| Flowchart | ✅ | ✅ | ❌ | ❌ | Process logic flow |
| Mind Map | ✅ | ✅ | ✅ | ✅ | Non-linear brainstorming |
| Markmap | ❌ | ❌ | ❌ | ✅ | Markdown-based mind maps |
| Org Chart | ✅ | ✅ | ✅ | ❌ | Organizational hierarchy |
| Fishbone (Ishikawa) | ✅ | ✅ | ❌ | ❌ | Root cause analysis |
| Tree Diagram | Limited | ✅ | ❌ | ✅ | Genealogy or logical tree |
| Timeline | Limited | ✅ | ❌ | ❌ | Linear history |
| Family Tree | Limited | ✅ | ❌ | ❌ | Ancestry mapping |
| Concept Map | Limited | ✅ | ❌ | ❌ | Conceptual relationship |
| Data Viz (Radar/Bar/Lin/Pie/Scatter) | 🖥/🤖/🌐 | ❌ | ✅ | ✅ | Chart generation from data |
Emoji Key
-
🖥 Desktop: Supported in Visual Paradigm Desktop (Precision & Traceability).
-
📖 OpenDocs: Supported in OpenDocs (Embedded in documents).
-
🤖 Chatbot: Supported in the AI Visual Modeling Chatbot (Rapid generation).
-
🌐 Web Apps: Supported in Guided Web Apps/Studios (Structured workflows).
-
❌ Not Supported: Feature not available in that specific platform.
-
Limited: Features available but with restricted functionality compared to Desktop.