Interaction modeling serves as a critical bridge between abstract system requirements and concrete software implementation. Among the various notations available, communication diagrams provide a unique perspective on how objects collaborate to achieve specific behaviors. This guide explores the historical trajectory, current applications, and future potential of these diagrams, offering a comprehensive look at how developers visualize object relationships over time. 🧩
Introduction to Interaction Modeling 🧩
In software engineering, understanding the dynamic behavior of a system is just as important as understanding its static structure. Interaction modeling focuses on the exchanges of messages between objects within a system. These diagrams help stakeholders visualize the flow of control and data, ensuring that all components align with the intended design. Communication diagrams are a specific type of interaction diagram that emphasizes the structural organization of the system rather than the strict chronological order of events. This distinction is vital for architects designing complex, object-oriented systems.
The primary goal of interaction modeling is to reduce ambiguity. By mapping out how objects communicate, teams can identify potential bottlenecks, circular dependencies, or missing functionality before writing a single line of code. This process is not merely documentation; it is a form of reasoning that allows developers to stress-test designs against real-world scenarios.
Historical Foundations: The Pre-UML Era 🏛️
To understand the current state of communication diagrams, one must look back at the methodologies that preceded the Unified Modeling Language. Before standardization, the field of software design was fragmented. Various object-oriented methods competed for dominance, each with its own notation for describing interactions.
- The Booch Method: Introduced by Grady Booch, this approach emphasized class diagrams and object diagrams. It included early forms of interaction modeling that focused heavily on the structural relationships between objects. The visual representation often used sequence-like flows but lacked a unified syntax.
- OMT (Object Modeling Technique): Developed by Rumbaugh, this method introduced object diagrams and state diagrams. It used interaction diagrams to show the sequence of events, laying the groundwork for later standardization.
- OOSE (Object-Oriented Software Engineering): Jacobson’s method introduced the use case concept, which heavily influenced how interactions were described in terms of user goals. This shifted the focus from pure object mechanics to user-centric system behavior.
During this period, tools for modeling were often proprietary and tied to specific development environments. The lack of a common language made collaboration across different teams difficult. Engineers struggled to translate diagrams created in one methodology into another without losing semantic meaning. This fragmentation created a clear need for a unified standard.
Standardization and the Birth of UML 📏
The late 1990s marked a turning point in software documentation. The Rational Software Corporation brought together Booch, Rumbaugh, and Jacobson to create the Unified Modeling Language. UML 1.0 was released in 1997, followed by significant updates in 1999 and 2005. This standardization allowed interaction modeling to become a universal language for software architects.
In the early versions of UML, interaction diagrams were categorized primarily as Sequence Diagrams. These diagrams focused on the temporal ordering of messages. However, developers quickly realized that time was not always the most critical factor in understanding system behavior. Sometimes, the topology of the connection mattered more than the sequence.
UML 1.1 introduced a second type of interaction diagram known as the Collaboration Diagram. This notation allowed developers to show the organization of objects and their links. It displayed messages as numbered labels on the links between objects. This approach provided a clearer view of the system’s structure while still conveying the flow of information. It was a significant evolution from the purely linear view offered by sequence diagrams.
Collaboration to Communication: The Rename 🔄
In UML 2.0, the terminology was refined to improve clarity. The Collaboration Diagram was renamed the Communication Diagram. While the visual structure remained largely similar, the name change reflected a shift in focus. The term “Collaboration” implied a broader social or organizational concept, whereas “Communication” strictly described the message passing between objects. This distinction helped align the diagram with its technical purpose within the system architecture.
The renaming also signaled a maturation of the standard. It acknowledged that while time is important, the structural context of where interactions occur is equally vital. In a large-scale system, knowing which component connects to which is often more critical for debugging than knowing the exact millisecond a message was sent. This shift in emphasis allowed architects to maintain a high-level view of system topology without getting lost in the minutiae of timing.
The evolution from Collaboration to Communication also coincided with improvements in tooling. As modeling software became more sophisticated, the ability to synchronize diagrams with code improved. This allowed communication diagrams to serve as living documents rather than static artifacts created once and forgotten.
Sequence vs. Communication: A Technical Comparison 🆚
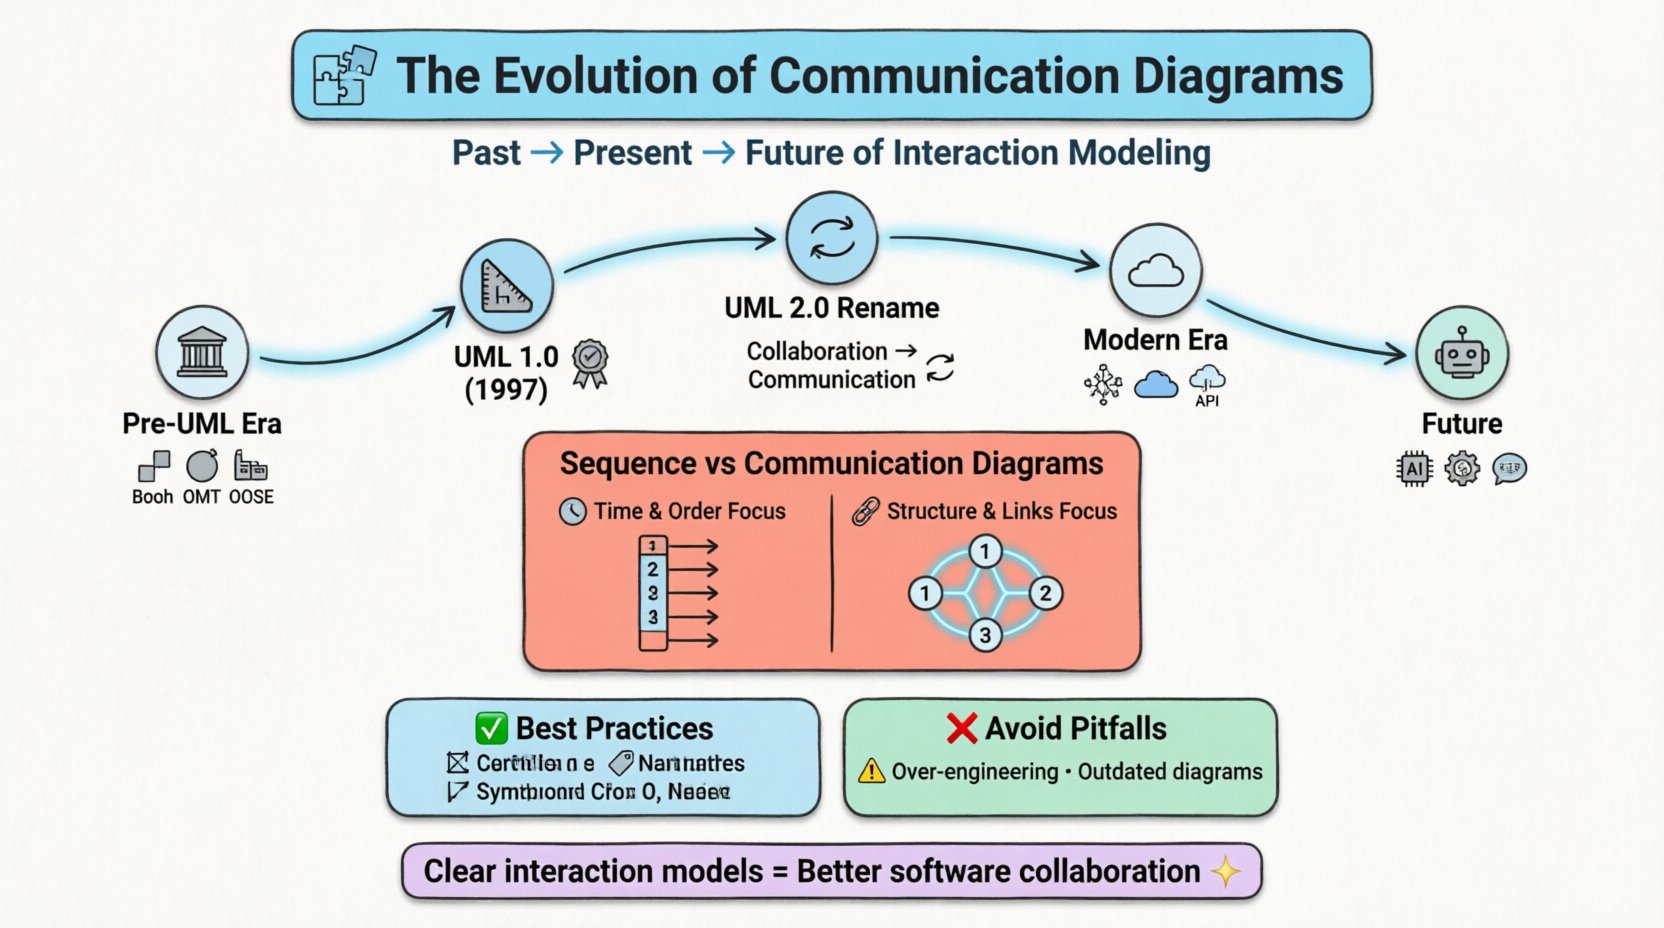
One of the most common questions in interaction modeling is when to use a Sequence Diagram versus a Communication Diagram. Both depict the same interaction, but they emphasize different aspects of the system. Understanding these differences is essential for effective documentation.
| Feature | Sequence Diagram | Communication Diagram |
|---|---|---|
| Primary Focus | Time and Order | Object Structure and Links |
| Visual Layout | Vertical timeline | Network topology |
| Message Labeling | Arrows along the timeline | Numbered labels on links |
| Complexity Handling | Better for complex temporal logic | Better for complex object relationships |
| Readability | Linear and easy to follow | Can become cluttered with many objects |
Sequence diagrams excel when the timing of events is critical. They are ideal for showing loops, conditionals, and wait states. The vertical arrangement naturally guides the eye from top to bottom, mimicking the flow of time. This makes them the preferred choice for detailed logic flows.
Communication diagrams, on the other hand, shine when the structural relationship is the story. For example, if a system involves a complex network of services passing data, a communication diagram shows the web of connections more clearly. It allows the viewer to see that Object A talks to Object B, which talks to Object C, without needing to trace a vertical line down a page.
However, communication diagrams have limitations. When the number of objects grows, the diagram can become a “spaghetti” of lines. This is why they are often used for subsystems or specific scenarios rather than entire system overviews. They are best used when the structural context provides more insight than the temporal sequence.
Interaction Modeling in Modern Architecture ☁️
The landscape of software development has shifted dramatically in the last decade. The rise of microservices, cloud-native architectures, and event-driven systems has changed how interaction modeling is applied. Communication diagrams must now account for asynchronous communication, distributed state, and network latency.
- Microservices: In a distributed environment, objects are often separate services. Communication diagrams help map out the API contracts and message flows between these services. They clarify which service owns which data and how queries are routed.
- API Design: REST and GraphQL APIs rely on clear interaction patterns. Diagrams help define the request-response cycles and error handling strategies. They serve as a blueprint for frontend and backend teams to agree on integration points.
- Event-Driven Systems: Modern systems often use message queues and event buses. Communication diagrams can illustrate how events are published and consumed by different listeners. This helps in visualizing the decoupling of components.
The challenge in modern architecture is keeping the diagrams synchronized with the code. In monolithic applications, changes were often localized. In distributed systems, a change in one service can ripple across the entire network. Documentation must be treated as a living artifact, updated alongside code commits.
Furthermore, the scale of interaction has increased. A single user action might trigger dozens of internal calls. Communication diagrams help manage this complexity by abstracting away low-level details and focusing on the high-level service interactions. This abstraction is crucial for onboarding new team members who need to understand the system architecture quickly.
Future Trajectories: Automation and Intelligence 🤖
As tools evolve, the process of creating interaction models is becoming more automated. The future of communication diagrams lies in integration with development pipelines and intelligent assistance.
- Model-Driven Engineering: Tools are moving towards generating code directly from models. This reduces the gap between design and implementation. If a communication diagram is the source of truth, the code should reflect it exactly.
- AI-Assisted Diagramming: Artificial intelligence can suggest improvements to diagrams. It can detect circular dependencies or recommend better naming conventions based on industry standards. This reduces the cognitive load on the architect.
- Real-Time Collaboration: Cloud-based modeling tools allow multiple architects to work on the same diagram simultaneously. This mimics the collaborative nature of modern software development, where decisions are made in real-time.
- Automated Validation: Future tools will likely validate diagrams against actual runtime logs. If a message flow is defined in the diagram but never occurs in the logs, the system can flag this discrepancy. This ensures the documentation matches reality.
The goal is to move from static documentation to dynamic models. Instead of creating a diagram once and archiving it, the model becomes an active part of the development process. It is used for testing, simulation, and performance analysis. This shift ensures that the value of the diagram is realized throughout the lifecycle of the software.
Best Practices for Sustainable Diagrams ✅
Creating effective communication diagrams requires discipline. A poorly constructed diagram can confuse more than it clarifies. To maintain clarity and utility, follow these guidelines:
- Limit Scope: Do not attempt to model the entire system in a single diagram. Break complex interactions down into manageable scenarios. Each diagram should focus on one specific use case or flow.
- Naming Conventions: Use consistent naming for objects and messages. Object names should reflect their role in the system (e.g., “OrderProcessor” instead of “Object1”). Message names should be action-oriented (e.g., “ValidateRequest” instead of “Call1”).
- Use Focus: If a diagram becomes too complex, use focus boxes. These allow you to drill down into a specific object and show its internal interactions without cluttering the main view.
- Version Control: Treat diagrams as code. Store them in version control systems. This allows you to track changes over time and revert if a design decision proves incorrect.
- Keep it Updated: Outdated diagrams are worse than no diagrams. Establish a rule that diagrams must be updated when the code changes. If a diagram cannot be updated, it should be marked as deprecated.
Adhering to these practices ensures that the diagrams remain a valuable asset for the team. They become a reference point for design discussions and a source of truth for new developers joining the project.
Common Pitfalls to Avoid ❌
Even experienced architects can fall into traps when creating interaction models. Being aware of these common mistakes helps in maintaining high-quality documentation.
- Over-Engineering: Trying to model every edge case leads to diagrams that are impossible to read. Focus on the happy path and major exception flows first. Details can be added later if necessary.
- Ignoring State: Interaction diagrams often show messages but not state changes. If an object changes state significantly during the interaction, it should be noted. Otherwise, the diagram might imply a state that does not exist.
- Confusing Structure with Behavior: A communication diagram shows behavior, but it relies on structure. Do not confuse class diagrams (structure) with communication diagrams (behavior). Each has a distinct purpose.
- Skipping Context: Always define the context of the diagram. What triggers the interaction? What is the expected outcome? Without this context, the diagram is just a collection of shapes.
- Tool Dependency: Avoid using proprietary features that lock you into a specific tool. Use standard UML notation whenever possible. This ensures that the diagrams can be viewed and edited by anyone with a standard reader.
By avoiding these pitfalls, teams can ensure that their interaction models remain clear, accurate, and useful. The diagram should serve the team, not the other way around.
Summary of Key Takeaways 📝
The evolution of interaction modeling reflects the maturation of software engineering as a discipline. From the fragmented methods of the 1990s to the standardized UML of today, the focus has shifted towards clarity and precision. Communication diagrams play a unique role in this landscape by emphasizing object structure over time. They complement sequence diagrams by providing a topological view of system interactions.
As architectures grow more distributed and complex, the need for clear interaction modeling becomes even more critical. Future advancements in automation and intelligence promise to make these diagrams more dynamic and integrated with the development process. However, the core principles remain the same: clarity, consistency, and maintenance. By adhering to best practices and avoiding common pitfalls, teams can leverage communication diagrams to build more robust and understandable systems.
Ultimately, the value of a diagram lies in its ability to communicate. Whether it is a developer understanding a legacy system or an architect designing a new microservice, the visual representation of interaction is an indispensable tool. As the industry moves forward, the ability to model interactions effectively will remain a fundamental skill for software professionals.