Concurrency issues are among the most elusive challenges in software development. When multiple threads or processes interact with shared resources, the resulting behavior can be unpredictable. Race conditions occur when the outcome of a system depends on the relative timing of events, such as the order in which messages are processed or how data is accessed. These logical flaws often do not manifest during standard testing, appearing only under specific load or timing conditions. To address this, engineers need tools that visualize interaction over time and state changes. Communication diagrams offer a structured approach to mapping these interactions.
Debugging logic without a visual aid is like navigating a complex city without a map. You know where you want to go, but the path is obscured by intersections and traffic patterns. In the context of system design, the “traffic” consists of asynchronous messages and state transitions. By employing communication diagrams, developers can trace the flow of control and data explicitly. This guide explores how to leverage these diagrams to identify race conditions before they impact production environments.
Understanding Race Conditions in System Logic 🧠
A race condition exists when two or more operations compete for the same resource, and the final state depends on the sequence or timing of their execution. This is not merely a coding error; it is a logical flaw in the design of the interaction between components. Consider a scenario where two processes attempt to update a shared counter simultaneously. If the read-modify-write cycle is not atomic, one update may be lost.
- Time-of-check to Time-of-use (TOCTOU): A classic vulnerability where the state of a resource is checked at one point, but the resource is used at a later point, potentially changing in the interim.
- Interleaved Execution: Threads execute instructions in an unpredictable order, leading to inconsistent data states.
- Message Ordering: In distributed systems, messages may arrive out of order, causing logic branches to execute based on stale information.
Traditional debugging tools often focus on stack traces or memory dumps. While useful, they do not inherently show the causal relationship between different system components. A race condition is often a relationship problem, not just a variable problem. Therefore, a diagram that emphasizes relationships and message flow is more effective for diagnosis.
The Power of Communication Diagrams 📊
Communication diagrams, formerly known as collaboration diagrams in UML 1.x, focus on the structural organization of objects and the messages they send to one another. Unlike sequence diagrams, which prioritize time vertically, communication diagrams prioritize the structural connections between objects. This perspective is crucial for spotting race conditions because it highlights shared connections.
When debugging, you are looking for points where multiple paths converge. In a communication diagram, these convergence points are often the sources of contention. The diagram consists of objects, links, and messages. Each message represents a call or a signal. By annotating these messages with timing constraints or priority levels, you can simulate the execution environment.
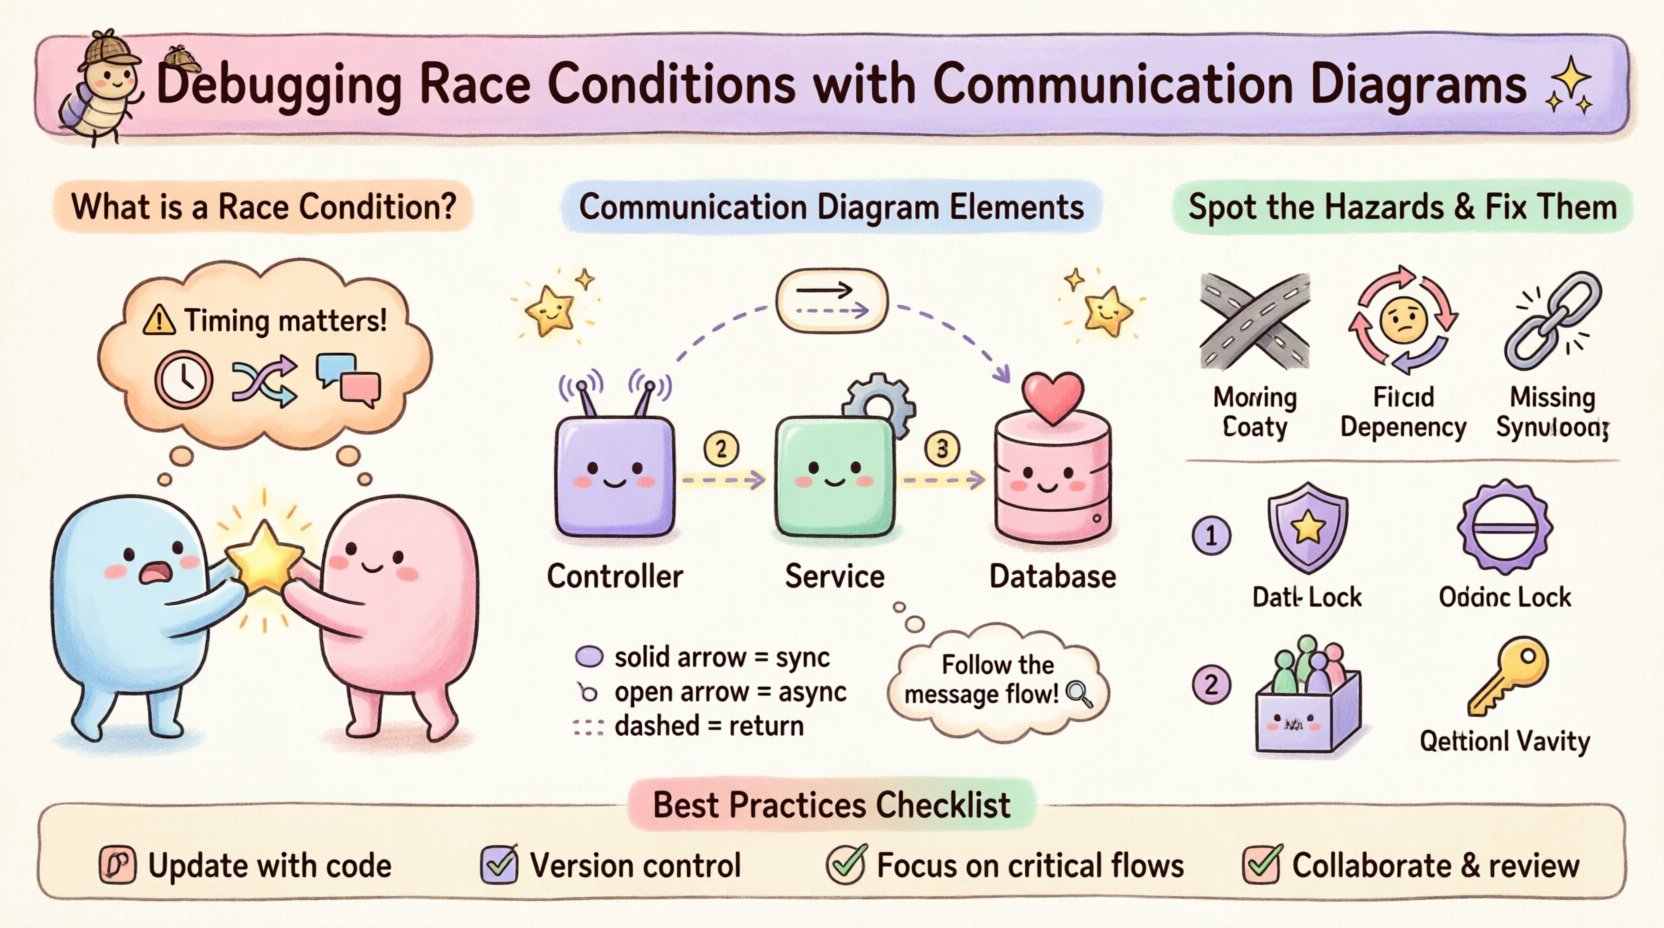
- Objects: Represent the active entities in the system, such as a Controller, a Service, or a Database.
- Links: Define the structural paths through which messages travel between objects.
- Messages: Represent the logic flow. They can be synchronous (blocking) or asynchronous (fire-and-forget).
The visual layout allows you to see the “hub” objects. These are the objects that interact with the most other entities. High connectivity often correlates with higher risk of concurrency issues. By isolating these hubs, you can focus your debugging efforts where they matter most.
Setting the Stage for Debugging 🛠️
Before drawing the diagram, you must understand the scope of the issue. Race conditions often stem from specific workflows. Identify the critical path where the data inconsistency occurs. For example, if a user profile update is failing intermittently, trace the flow from the API endpoint to the data store.
Here is a checklist to prepare your environment for diagrammatic analysis:
- Define the Actors: List all external systems or users initiating requests.
- Identify Internal Objects: Break down the internal architecture into logical components (e.g., Cache, API, Worker).
- List the Messages: Enumerate the specific function calls or events that occur during the workflow.
- Mark Shared Resources: Highlight any database tables, memory variables, or file locks accessed by multiple objects.
Once the scope is defined, you can begin constructing the diagram. The goal is not to create a perfect architectural model, but a debugging artifact. Simplify where necessary. If a component does not contribute to the race condition, exclude it. Clarity is more important than completeness in this phase.
Step-by-Step: Mapping the Flow 🔍
Creating the diagram for debugging requires a specific methodology. You are mapping logic, not just structure. Follow these steps to build an effective debugging artifact.
1. Place the Initiator and the Target
Start by placing the object that initiates the request on the left or top. Place the primary object being affected on the right or bottom. This establishes the direction of the flow. For example, if a UserService calls a Database, the User object sends a message to the Database.
2. Add Intermediate Objects
Map out any middleware or caching layers. In a race condition scenario, a cache layer is a frequent suspect. If the cache is updated before the database, a stale read can occur. If the database is updated before the cache, the cache may show old data. Draw a link for every intermediate step.
3. Annotate Message Types
Distinguish between synchronous and asynchronous messages. Synchronous messages imply a wait state. Asynchronous messages imply a fire-and-forget behavior. Race conditions often arise from asynchronous calls where the response is expected but not guaranteed to arrive in order.
- Synchronous: Use a solid line with a solid arrowhead.
- Asynchronous: Use a solid line with an open arrowhead.
- Return Messages: Use a dashed line with an open arrowhead.
4. Label the Links
Assign a number to each message to indicate the sequence. This is vital for debugging. In a communication diagram, the sequence is implied by the numbers, not just the vertical position. Ensure that the numbers reflect the logical order of execution as best as you can understand it.
Identifying Concurrency Hazards in the Diagram ⚠️
Once the diagram is drawn, you must analyze it for specific patterns that indicate instability. Look for these structural red flags.
- Converging Paths: If two different message flows lead to the same object to modify the same data, a race condition is possible. This indicates multiple entry points to a critical section.
- Circular Dependencies: If Object A calls Object B, and Object B calls Object A within the same logical transaction, the system may deadlock or behave unpredictably.
- Missing Synchronization: If a critical update is sent asynchronously without a confirmation message before the next step, the subsequent logic might proceed with outdated data.
Consider the “Double-Check Locking” pattern. It is a common optimization that fails without proper memory barriers. In a diagram, this looks like a check message followed by an update message. If another thread performs the check between the two steps, the update happens unnecessarily.
Analyzing Message Ordering and Timing ⏱️
Timing is the invisible variable in race conditions. Communication diagrams can represent timing constraints using notes or specific annotations. While they do not show exact milliseconds, they show logical precedence.
Use the following strategies to analyze timing:
- Parallelism: Draw parallel branches to represent simultaneous execution. If two branches converge on a shared resource, the order of arrival determines the outcome.
- Timeouts: Add annotations indicating expected timeouts. If a message does not return within a certain timeframe, does the system retry? Retries can create duplicate updates.
- Eventual Consistency: If the system relies on eventual consistency, the diagram must show the lag between the write operation and the read availability. This lag is where race conditions hide.
For example, if a notification service sends an email after a payment is confirmed, but the payment confirmation is asynchronous, the email might be sent before the money is actually secured. The diagram should explicitly show the gap between the payment confirmation event and the email trigger.
Common Patterns Leading to Instability 🔄
Certain architectural patterns are prone to race conditions. Recognizing them in your diagram can speed up the debugging process.
| Pattern | Risk Description | Diagram Indicator |
|---|---|---|
| Read-Modify-Write | Two processes read the same value, modify it, and write it back. The second write overwrites the first. | Multiple messages targeting the same data store with no lock mechanism shown. |
| Fire-and-Forget | An event is fired without waiting for acknowledgment. Subsequent logic assumes success. | Asynchronous message arrow with no return path or confirmation message. |
| Cache Invalidation | Data is updated in the database but not the cache, or vice versa. | Parallel paths to Database and Cache with no synchronization point. |
| Idempotency Failures | A request is retried, causing duplicate actions to occur. | Loopback arrows indicating retries without a unique transaction ID check. |
When you see these patterns in your diagram, pause. Ask yourself: “What happens if Message B arrives before Message A?” or “What happens if the system crashes between step 3 and step 4?” These questions often reveal the logic gaps.
Mitigation Strategies Once Identified 🛡️
Once the race condition is visualized and understood, you can apply structural changes. The diagram helps you decide which architectural change is appropriate.
- Locking Mechanisms: If the diagram shows concurrent access to a resource, introduce a lock object. In the diagram, this appears as a message to a Lock Manager before accessing the data.
- Optimistic Locking: Instead of blocking, use version numbers. The diagram should show a check for a version number before the write operation.
- Queueing: If the issue is caused by too many parallel requests, introduce a message queue. The diagram changes from direct calls to a queue object that serializes the messages.
- Idempotency Keys: Ensure that every request has a unique identifier. The diagram should show this ID being passed and checked against existing records.
Updating the diagram after applying these fixes is crucial. It serves as documentation for future developers. It proves that the design was reviewed and the risk was mitigated.
Best Practices for Diagram Maintenance 📝
Diagrams are living documents. If they become outdated, they lose their value as debugging tools. Keep them relevant by following these practices.
- Update on Code Changes: If the logic flow changes, the diagram must change. Do not let the diagram drift from reality.
- Version Control: Store diagrams alongside the codebase. This ensures that the debugging context is available when new developers join.
- Focus on Flows: Do not diagram every function. Focus on the critical paths where concurrency is possible.
- Collaborate: Review the diagram with peers. A fresh set of eyes might spot a path you missed, such as a background job that was forgotten.
Documentation should be concise. Use standard notations so that anyone on the team can interpret the diagram without a legend. Consistency in notation reduces cognitive load when debugging.
Comparison: Sequence vs. Communication Diagrams 📋
While sequence diagrams are more common, communication diagrams have specific advantages for race condition debugging. Both use similar notations but emphasize different aspects.
- Sequence Diagrams: Emphasize time. They show a strict vertical timeline. They are excellent for understanding the exact order of events but can become cluttered with complex object relationships.
- Communication Diagrams: Emphasize structure. They show how objects are connected. They are better for seeing the “network” of interactions and identifying shared hubs.
For race conditions, the structural view is often more revealing. A sequence diagram might show that two messages happened at the same time, but a communication diagram shows that they both went to the same object. This structural insight points directly to the resource contention.
Use the following criteria to choose:
- Choose Sequence Diagrams: When the exact timing order is complex and linear.
- Choose Communication Diagrams: When the relationship between objects is complex and non-linear.
Final Thoughts on Logic Debugging 🎯
Debugging logic requires more than just tracing code. It requires understanding the interactions between components. Communication diagrams provide a high-level view of these interactions. By visualizing the flow of messages and the sharing of resources, you can spot race conditions before they cause data corruption.
The process is iterative. Draw the diagram, analyze the paths, identify the hazards, and then refine the logic. This cycle ensures that the system remains robust under concurrent load. Avoid the temptation to rely solely on automated tests, as they often miss timing-dependent edge cases. Visualizing the logic forces you to confront the concurrency model directly.
Adopting this approach builds a deeper understanding of your system. It shifts the focus from fixing symptoms to fixing the underlying design. As you gain experience with these diagrams, you will find that you can predict potential concurrency issues before writing a single line of code. This proactive stance is the hallmark of a mature engineering practice.
Remember, the goal is clarity. If the diagram is confusing, the logic is likely flawed. Simplify the model until the path of data is unmistakable. With clear diagrams, race conditions become visible problems that can be solved with confidence.