Understanding interaction modeling within Unified Modeling Language (UML) is essential for clear system architecture. Two primary tools exist for depicting object interactions: Sequence Diagrams and Communication Diagrams. Both serve the purpose of visualizing how objects communicate to achieve a specific behavior, yet they emphasize different aspects of the system design. Choosing the right one depends on the specific communication flow, the complexity of the object relationships, and the audience reading the documentation.
This guide explores the structural and functional distinctions between these two interaction diagrams. We will analyze when each format provides better clarity for developers and stakeholders. By examining the visual syntax, the representation of time, and the focus on object relationships, you can determine the most effective tool for your specific modeling needs.
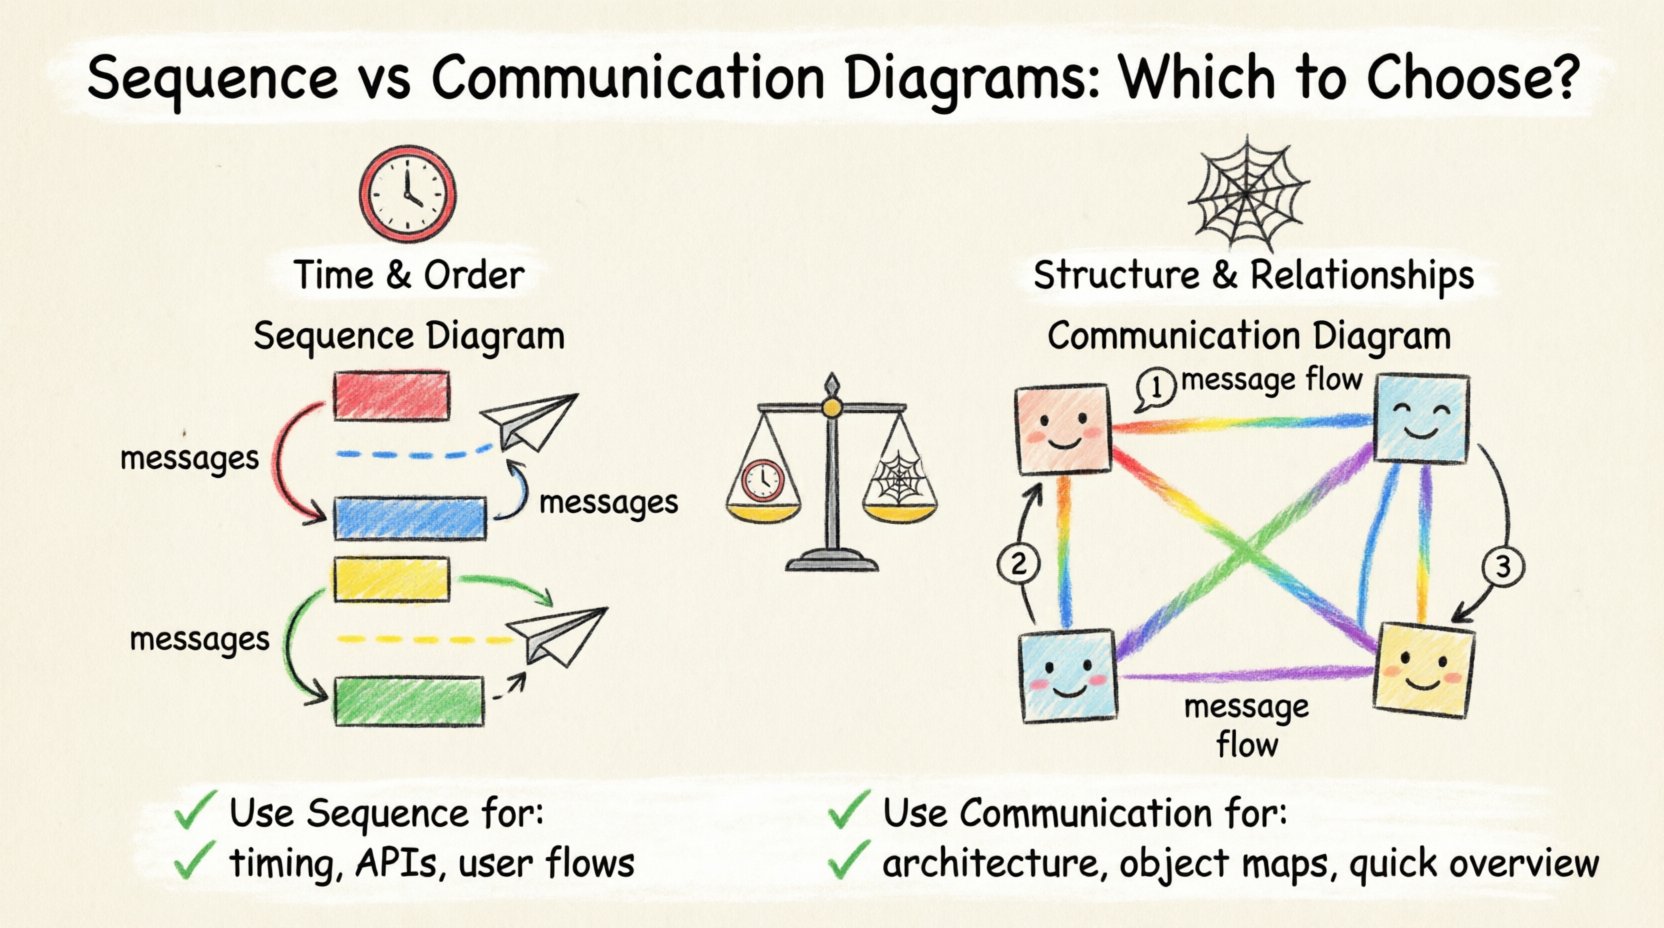
Understanding Sequence Diagrams ⏱️
A Sequence Diagram focuses primarily on the temporal aspect of interactions. It arranges objects horizontally and messages vertically, creating a timeline that flows from top to bottom. This layout makes it intuitive to understand the order of events as they occur within a specific scenario.
Core Components
Lifelines: Vertical dashed lines representing the existence of an object or actor over time.
Messages: Horizontal arrows connecting lifelines, indicating the flow of information or control.
Activation Bars: Rectangular boxes on lifelines showing when an object is active or processing a task.
Return Messages: Dashed arrows indicating the return of control or data to the caller.
Strengths of the Sequence Approach
Temporal Clarity: The vertical flow explicitly shows the sequence of operations. It is impossible to misinterpret the order of messages.
Duration Visibility: Activation bars allow you to see how long an object remains busy processing a request.
Concurrency: It is easier to visualize parallel processing and asynchronous messages using specific arrow styles.
State Changes: The diagram naturally supports showing state transitions over time within a specific use case.
When designing complex workflows where the timing of a message affects the outcome, the Sequence Diagram is often the superior choice. It helps developers identify race conditions or bottlenecks where a process waits too long for a response. It is particularly useful for documenting API calls, database transactions, and user session flows.
Understanding Communication Diagrams 🕸️
A Communication Diagram (formerly known as a Collaboration Diagram) emphasizes the structural organization of objects rather than the timeline. Objects are positioned based on their relationships, and messages are numbered to indicate the sequence of interactions. This approach treats the diagram as a map of the system’s topology.
Core Components
Objects: Represented by boxes with labels, positioned to show structural proximity or logical grouping.
Links: Lines connecting objects to indicate structural relationships (associations).
Messages: Numbered arrows between objects, indicating the order of execution.
Multiplicity: Often used to show how many instances of an object are involved in the interaction.
Strengths of the Communication Approach
Structural Focus: It highlights the relationships between objects more clearly than a sequence diagram.
Conciseness: It can represent complex interactions without the vertical space required by lifelines.
Path Visualization: It is easier to see the full path of data across the system architecture in a single glance.
Navigation: The numbered messages allow for easy reference when reading non-linear flows.
Communication Diagrams are ideal when the relationship between objects is more critical than the exact timing of the interaction. They are excellent for high-level architectural overviews where the focus is on which objects talk to each other, rather than the milliseconds between calls.
Key Differences at a Glance 📊
To make an informed decision, it is helpful to compare the technical specifications side by side. The following table outlines the primary distinctions.
Feature | Sequence Diagram | Communication Diagram |
|---|---|---|
Primary Focus | Time and Order | Structure and Relationships |
Layout | Vertical flow (Top to Bottom) | Spacial arrangement (Object to Object) |
Sequence Indication | Position on the vertical axis | Numerical labels on arrows |
Relationship Visibility | Implied by proximity | Explicit links between objects |
Complexity Handling | Can become very tall | Can become cluttered spatially |
Best For | Detailed logic, API flows | Architecture, object navigation |
When to Choose a Sequence Diagram 📜
Selecting the Sequence Diagram is often the default choice for detailed implementation documentation. There are specific scenarios where this format provides significantly more value.
1. Complex Logic Flows
If your system involves nested loops, conditional branches, or intricate error handling, the Sequence Diagram excels. You can use combined fragments (like alt, opt, loop) to clearly denote branching logic. A Communication Diagram struggles to represent these logical structures without becoming confusing.
2. Performance and Timing Analysis
When analyzing system performance, knowing the duration of an operation is vital. The activation bars in a Sequence Diagram allow you to estimate processing time. If you need to identify where latency occurs in a chain of microservices, this diagram type is necessary.
3. Asynchronous Interactions
Modern systems often rely on asynchronous messaging queues. Sequence Diagrams have specific syntax for non-blocking messages. You can clearly show a sender continuing its work without waiting for a response, which is harder to convey in a spatial Communication Diagram.
4. User Interface Interactions
For front-end development, showing the sequence of user actions and system responses is critical. The linear nature of the Sequence Diagram matches the linear nature of user experience flows. It helps designers ensure the interface responds correctly at every step.
When to Choose a Communication Diagram 🧩
While Sequence Diagrams are popular for detail, the Communication Diagram offers a different perspective that is sometimes more beneficial for specific tasks.
1. High-Level Architecture Reviews
During architectural reviews with stakeholders who are less technical, the structure of the system is often more important than the timing. A Communication Diagram provides a “map” of the system, showing which modules connect to which. It reduces cognitive load by removing the vertical timeline.
2. Object-Oriented Design
If the goal is to review the object model itself, the Communication Diagram is superior. It explicitly draws the links between objects, reinforcing the association relationships defined in the Class Diagram. This helps ensure that the interaction design aligns with the structural design.
3. Limited Vertical Space
Sequence Diagrams can grow extremely tall if the interaction chain is long. In a document or presentation where vertical space is constrained, a Communication Diagram can compress this information into a compact spatial layout. It allows you to see the entire interaction network without scrolling.
4. Iterative Refinement
When modifying an existing system, it can be easier to add new connections to a Communication Diagram than to restructure a complex Sequence Diagram. Adding a new object to the spatial layout is often faster than inserting a new lifeline into a dense vertical sequence.
Detailed Comparison of Technical Features 🔧
Beyond the high-level differences, there are technical nuances in how these diagrams handle specific UML constructs.
Object Creation and Destruction
Both diagrams support the creation and destruction of objects. In a Sequence Diagram, this is shown by the appearance or disappearance of the lifeline. In a Communication Diagram, it is shown by the creation or termination of the object symbol itself. The Sequence Diagram makes the lifecycle of an object more visible over the duration of the scenario.
Message Navigation
Sequence Diagrams rely on reading from top to bottom. If a message is passed through multiple layers, the eye must follow the vertical path. Communication Diagrams rely on reading numbered arrows. If the diagram is large, the eye must jump across the canvas. For short interactions, the jump is negligible. For long chains, the vertical flow of the Sequence Diagram is easier to follow.
Feedback and Return Values
Returning data is a common requirement. Sequence Diagrams use dashed arrows pointing back to the sender. Communication Diagrams use numbered arrows pointing back. In a Communication Diagram, if the return message is not numbered sequentially, it can be hard to track the flow. Sequence Diagrams inherently handle return paths through the vertical positioning.
Managing Complexity and Maintenance 🛠️
Maintaining diagrams over the lifecycle of a project is a significant challenge. Both diagram types have specific maintenance considerations.
Version Control and Diffing
Sequence Diagrams are often easier to diff in version control systems because the changes are usually localized to specific vertical sections. Adding a step at the bottom of a sequence diagram does not affect the structure above. In a Communication Diagram, adding a new object might require repositioning all existing objects to maintain a clean layout. This can lead to visual noise in version control diffs.
Scalability
As the number of objects increases, the Sequence Diagram remains relatively stable because new objects are added as new columns. The Communication Diagram becomes a “spaghetti diagram” more quickly. If you have more than five interacting objects, the spatial layout can become unreadable. In such cases, the Sequence Diagram is the safer choice for scalability.
Tooling and Automation
Most modeling tools support both diagram types equally. However, generating code from Sequence Diagrams is a common workflow for creating interface stubs. Generating code from Communication Diagrams is less common because the structural links are less explicitly tied to code execution order. If your goal is to automate code generation, the Sequence Diagram provides more actionable data.
Common Mistakes to Avoid 🚫
Regardless of the diagram type chosen, certain pitfalls can reduce the effectiveness of your documentation.
Overloading the Diagram: Do not try to show every possible interaction in a single diagram. Split complex scenarios into multiple diagrams. One diagram should focus on one specific use case or flow.
Inconsistent Naming: Ensure object labels match the class names in your codebase exactly. Inconsistency creates confusion for developers trying to map the diagram to the code.
Ignoring Return Messages: Always show the return path. If a method returns data, the diagram should reflect that. Hiding return messages obscures the full data flow.
Mixing Responsibilities: Do not mix high-level business flows with low-level technical details in the same diagram. Keep business logic separate from database implementation details.
Neglecting the Audience: If the audience is a business analyst, avoid technical message signatures. If the audience is a developer, include the specific operation names and parameter types.
Integrating Both in Documentation 📚
There is no rule stating you must choose only one. A robust documentation strategy often utilizes both. You might use a Communication Diagram to provide an overview of the system architecture and object relationships. Then, for critical paths, use Sequence Diagrams to detail the exact execution logic.
This layered approach ensures that stakeholders get the big picture without getting lost in the details, while developers have the precise sequence needed for implementation. When transitioning from design to code, the Sequence Diagram serves as the primary blueprint for logic, while the Communication Diagram serves as the blueprint for object connectivity.
Summary of Best Practices ✅
To ensure your interaction diagrams are effective, adhere to the following guidelines.
Start with the Goal: Define what you want to communicate before drawing. Is it the order of events or the connection of objects?
Keep it Simple: Remove unnecessary objects. Only include objects that participate in the specific interaction being modeled.
Use Standard Notation: Follow UML standards for arrows, activation bars, and object shapes to ensure universal understanding.
Review Regularly: Diagrams become outdated quickly. Update them whenever the code changes significantly.
Focus on Readability: If a diagram takes more than two minutes to understand, simplify it. Break it into smaller steps.
The choice between a Communication Diagram and a Sequence Diagram is not about which is better, but which is more appropriate for the context. Sequence Diagrams provide the timeline necessary for implementation and testing. Communication Diagrams provide the structure necessary for architectural understanding. By understanding the strengths and limitations of each, you can create documentation that accurately reflects your system’s design and facilitates better collaboration across the development team.
Ultimately, the value of these diagrams lies in their ability to reduce ambiguity. Whether you choose the vertical flow of the Sequence or the spatial map of the Communication, the goal remains the same: clear, precise, and maintainable system documentation.