In the landscape of distributed systems, visualizing how services interact is critical for maintaining system integrity and understanding data flow. As architectures shift from monolithic structures to microservices, the traditional methods of mapping interactions require significant adaptation. Communication diagrams, once static representations of software design, are transforming into dynamic tools that reflect the complexity of modern environments. This guide explores the trajectory of these diagrams, focusing on their role in asynchronous messaging, service mesh integration, and automated observability.
Understanding the Shift from Static to Dynamic Modeling 📊
Historically, communication diagrams served as blueprints created during the design phase. They depicted objects and their relationships in a linear fashion. In a monolithic application, this was sufficient because the context was contained within a single deployment unit. However, microservice architecture introduces distributed boundaries, network latency, and independent failure domains. A static diagram no longer captures the reality of a system that scales horizontally and evolves continuously.
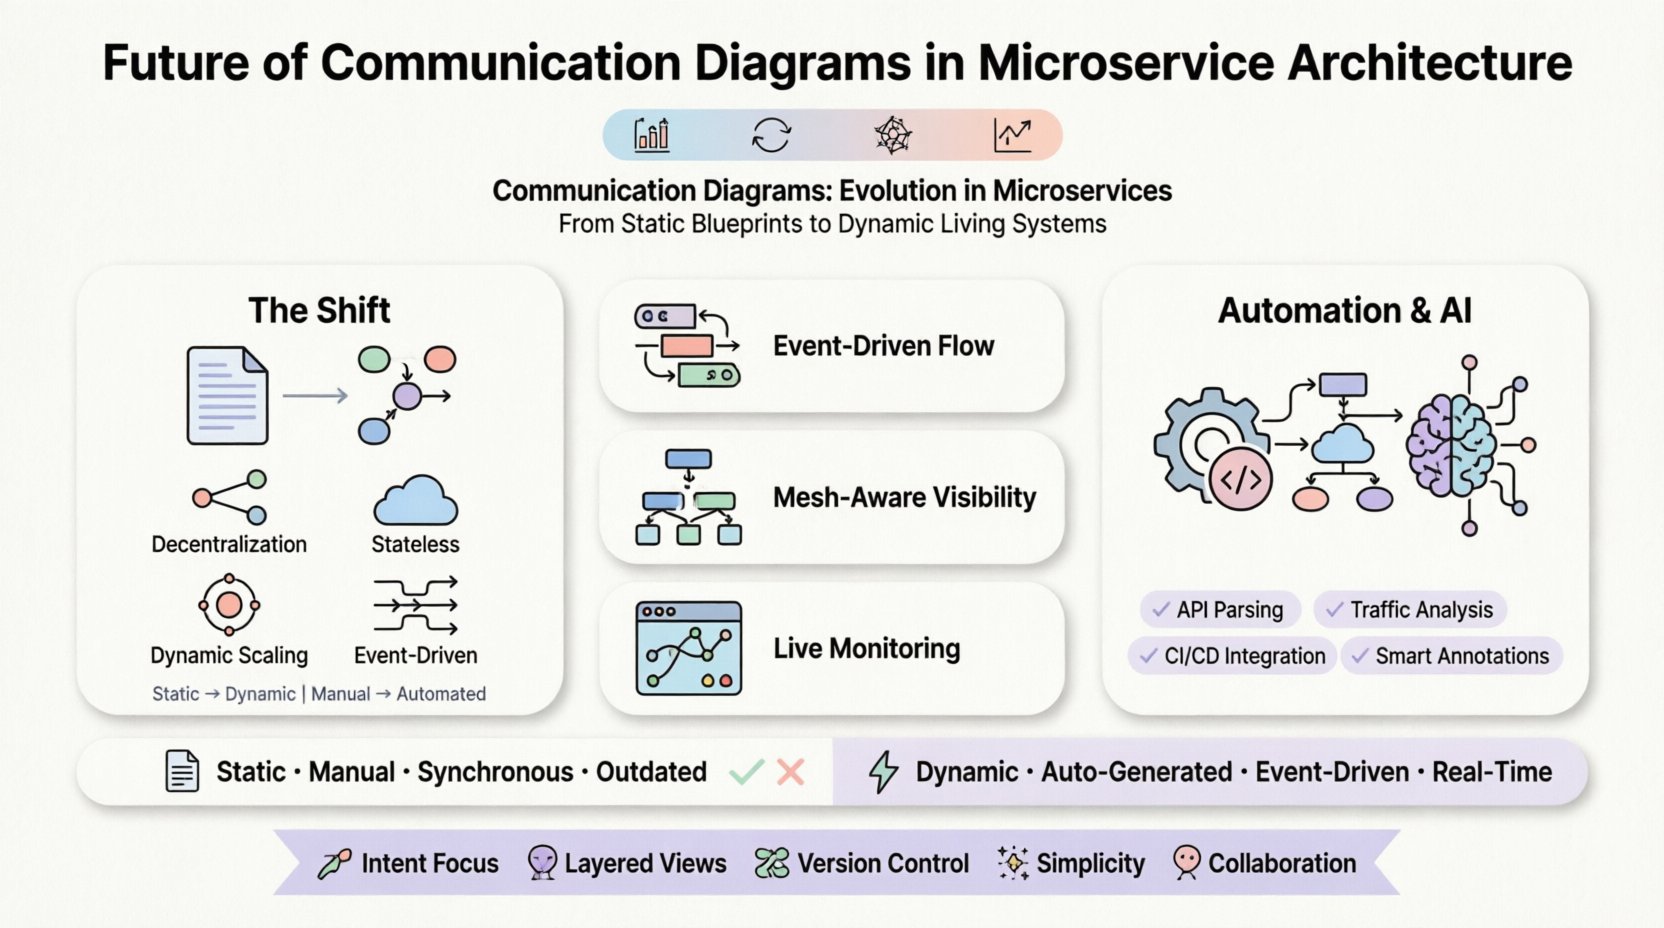
The future lies in diagrams that are not just documentation, but living artifacts. These artifacts must update as the infrastructure changes. Several factors drive this evolution:
- Decentralization: Services operate independently, requiring diagrams that show connections across organizational and network boundaries.
- Statelessness: The removal of state from individual services changes how interaction flows are visualized.
- Dynamic Scaling: Instances of a service may appear or disappear rapidly, making fixed topology diagrams inaccurate.
- Event-Driven Nature: Synchronous calls are being replaced by asynchronous events, altering the flow representation.
Developers and architects are moving towards models where the diagram is generated from the actual traffic patterns or code definitions rather than manual drawing. This ensures that the visual representation matches the running system.
Asynchronous Messaging and Event-Driven Patterns 🔄
One of the most significant changes in modern architecture is the move away from synchronous request-response models. Services often communicate via message queues or event streams. This shift fundamentally changes how communication diagrams are structured.
Traditional diagrams show a caller waiting for a response. In an event-driven system, the caller sends a message and continues processing. The response may come later or trigger another service entirely. Visualizing this requires new notations and conventions.
Key Characteristics of Event-Based Diagrams
- Decoupled Interaction: The sender does not need to know the receiver’s identity, only the topic or channel.
- Time Delays: Diagrams must indicate potential latency between sending and receiving.
- Reliability Mechanisms: Visual cues for retries, dead-letter queues, and acknowledgment strategies are essential.
- Broadcasting: One-to-many communication patterns require distinct visual markers compared to point-to-point links.
When designing these diagrams, it is crucial to represent the state of the message. Is it processed once or at-least-once? Does it have a lifecycle? These details impact how engineers troubleshoot issues when data gets stuck in a pipeline.
Integration with Service Mesh Infrastructure 🕸️
Service mesh technologies have become a standard component in orchestrating microservice traffic. They handle tasks like traffic splitting, retry logic, and security policies at the infrastructure layer. This abstraction layer adds complexity to communication visualization.
In a mesh-enabled environment, direct service-to-service communication often goes through a sidecar proxy. A communication diagram must reflect this intermediate hop. The logical service call is no longer a direct line between two components but passes through the mesh control plane.
Visualizing the Service Mesh
Effective diagrams in this context should distinguish between:
- Application Logic: The business logic running in the container.
- Infrastructure Traffic: The encrypted and managed traffic flowing through the proxy.
- Control Plane: The management layer that configures the proxies.
This separation helps teams understand where a failure occurs. Is it a bug in the code, or is it a configuration issue in the mesh? By layering the diagram, engineers can diagnose network-level issues without getting lost in business logic details.
Observability and Real-Time Visualization 📈
Observability tools provide deep insights into system performance through traces, logs, and metrics. The future of communication diagrams involves integrating these data streams directly into the visual model. Instead of a static image, the diagram becomes an interactive dashboard.
Benefits of Live Diagrams
- Hot-Spot Identification: Nodes that are experiencing high latency or error rates are highlighted automatically.
- Traffic Flow: Animated lines show the actual volume of data moving between services.
- Health Status: Color coding indicates the current health of each service instance.
- Dependency Mapping: Visualizing how a change in one service impacts others in real-time.
This approach reduces the time spent correlating data from different sources. Engineers can see the impact of a deployment immediately. It transforms the diagram from a reference document into a monitoring tool.
Automation and CI/CD Integration 🤖
Maintaining accurate diagrams manually is unsustainable in fast-paced development cycles. The industry trend is towards automation where diagrams are generated from the codebase or deployment configurations. This ensures that documentation is never out of sync with the code.
Automation Strategies
- API Definition Parsing: Extracting endpoints from OpenAPI or GraphQL schemas to build interaction maps.
- Container Manifest Analysis: Reading deployment configurations to identify service dependencies.
- Network Traffic Analysis: Using packet inspection to map actual runtime communication paths.
- Code Analysis: Scanning source code for import statements or function calls that indicate dependencies.
This automation reduces the administrative burden on architects. It allows teams to focus on design and optimization rather than documentation maintenance. However, it requires careful configuration to ensure the generated diagrams are readable and not overly cluttered.
Comparison: Traditional vs. Modern Communication Diagrams 📋
| Feature | Traditional Diagrams | Modern Diagrams |
|---|---|---|
| Creation Method | Manual drawing by architects | Automated generation from code/traffic |
| Accuracy | Static, often outdated quickly | Dynamic, reflects real-time state |
| Interaction Type | Synchronous request-response | Asynchronous, event-driven, mesh-aware |
| Integration | Stand-alone documentation | Integrated with monitoring and CI/CD |
| Update Frequency | Whenever code changes | Continuous or on-demand |
| Debugging Utility | High-level design reference | Real-time troubleshooting and tracing |
Challenges in Implementation ⚠️
While the evolution offers significant benefits, implementing dynamic communication diagrams presents several challenges. Teams must navigate technical and organizational hurdles to succeed.
Technical Challenges
- Scalability: Rendering complex topologies with hundreds of services can degrade performance.
- Data Privacy: Traffic analysis may expose sensitive data that needs masking.
- Standardization: Lack of universal standards for representing dynamic flows can lead to confusion.
- False Positives: Automated generation might infer dependencies that do not actually exist at runtime.
Organizational Challenges
- Adoption: Teams accustomed to static diagrams may resist adopting automated tools.
- Training: Engineers need training to interpret complex, data-driven visualizations.
- Tooling Costs: Advanced observability platforms can be expensive to deploy and maintain.
The Role of AI in Diagram Evolution 🧠
Artificial intelligence is beginning to play a role in how diagrams are interpreted and suggested. Machine learning models can analyze historical traffic data to predict future bottlenecks or suggest optimal service boundaries.
Potential applications include:
- Pattern Recognition: Identifying recurring communication patterns that indicate potential architectural flaws.
- Automated Refactoring: Suggesting service splits based on communication frequency.
- Intelligent Annotations: Automatically adding context or warnings to diagram nodes based on performance metrics.
- Natural Language Querying: Allowing engineers to ask questions about the diagram using plain language.
This integration moves the diagram from a passive representation to an active advisor. It helps teams make informed decisions about scaling and restructuring without manual analysis of vast amounts of data.
Best Practices for Modern Communication Diagrams 🛠️
To effectively leverage these evolving diagrams, teams should adhere to specific practices. These guidelines ensure clarity and utility across the organization.
- Focus on Intent: Show the business intent of the interaction, not just the technical protocol.
- Layer Complexity: Provide high-level views for executives and detailed views for developers.
- Version Control: Store diagram configurations alongside code to track changes over time.
- Keep it Simple: Avoid cluttering the visual with too much data. Focus on critical paths.
- Collaborative Editing: Allow multiple engineers to contribute to the model to ensure accuracy.
Final Thoughts on Architecture Visualization 💡
The evolution of communication diagrams in microservice architecture reflects the broader shift towards distributed, resilient, and observable systems. Static blueprints are giving way to dynamic, data-driven models that provide real-time insights. This transition empowers engineering teams to manage complexity more effectively.
By embracing automation, integration with service mesh, and event-driven modeling, organizations can maintain a clear understanding of their system’s behavior. The diagram becomes a shared language between developers, operations, and business stakeholders. It bridges the gap between abstract design and concrete execution.
As technology continues to advance, these visual tools will likely become even more integrated into the development lifecycle. They will serve not just as documentation, but as active components of the system’s self-healing and self-optimizing capabilities. The future of software architecture depends on our ability to visualize and understand the invisible connections that bind our services together.
Frequently Asked Questions ❓
Q: Do I still need to draw diagrams manually?
A: Manual drawing is becoming less necessary. Automated generation from code or traffic is preferred for accuracy and speed. However, high-level conceptual designs may still require human input.
Q: How do I handle security in communication diagrams?
A: Sensitive endpoints and data flows should be masked or abstracted. Use generic labels for secure channels and avoid exposing internal IP addresses or specific authentication tokens.
Q: Can these diagrams help with debugging production issues?
A: Yes, real-time diagrams can highlight failing nodes and show traffic backlogs, making it easier to pinpoint the source of an outage.
Q: What tools are used for this?
A: Various platforms exist that integrate with orchestration and monitoring systems to generate these views. Look for solutions that support API parsing and traffic analysis.
Q: Is this suitable for small teams?
A: While designed for large distributed systems, the principles of clear communication modeling apply to any architecture. Start simple and scale the complexity as needed.