Building a company is rarely a linear path. It involves navigating uncertainty, validating assumptions, and constantly adapting to market feedback. For first-time entrepreneurs, the journey from a simple concept to a public company (IPO) can feel overwhelming. A structured framework is essential to maintain clarity during this complex process. The Business Model Canvas (BMC) serves as that foundational tool. It allows founders to visualize, design, and pivot their business strategy effectively.
This guide details how to utilize the Business Model Canvas throughout the lifecycle of a venture. We will explore the nine building blocks, how they evolve from validation to scaling, and what specific metrics matter as you approach an Initial Public Offering. This approach ensures you are not just building a product, but a sustainable economic engine.
What Is the Business Model Canvas? 🧩
The Business Model Canvas is a strategic management template that describes the rationale of how an organization creates, delivers, and captures value. Unlike a traditional 50-page business plan, the Canvas condenses the core strategy onto a single page. It was developed by Alexander Osterwalder and Yves Pigneur.
Its primary advantage lies in its visual nature. It forces clarity. Instead of writing paragraphs about strategy, you place elements into specific categories. This makes gaps in logic immediately visible. For early-stage founders, this is critical because it highlights where assumptions need testing.
The Nine Building Blocks
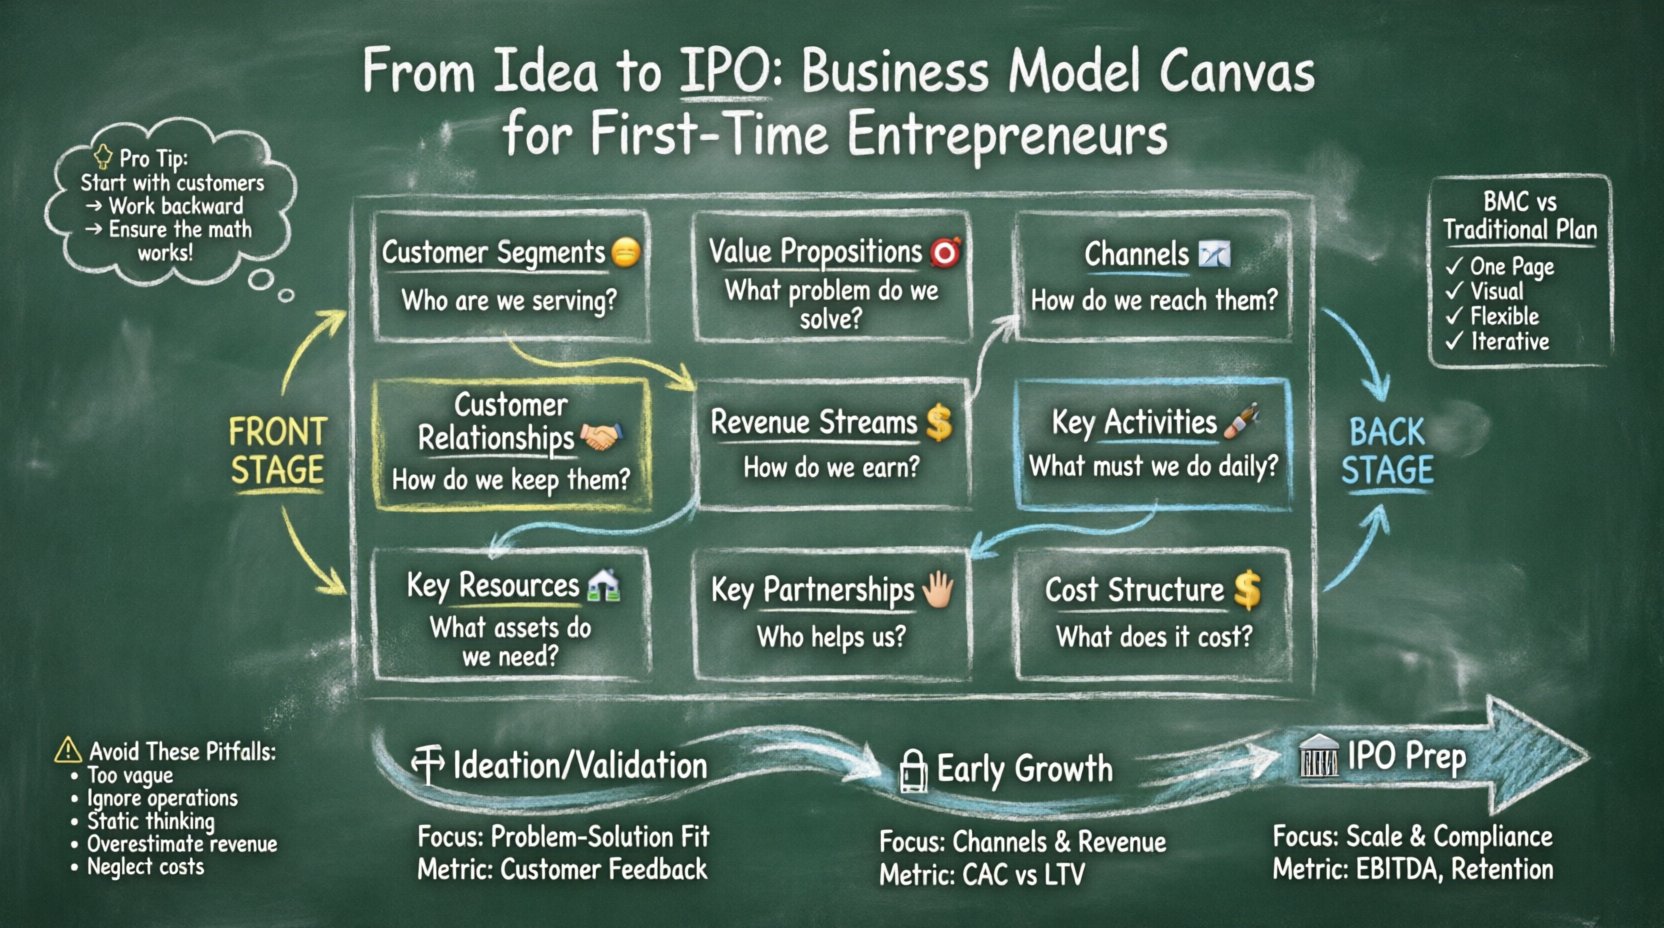
The framework consists of nine distinct sections. These sections are divided into two sides: the front stage (what the customer sees) and the back stage (how the business operates). Understanding the relationship between these blocks is key to coherence.
| Category | Block Name | Focus |
|---|---|---|
| Front Stage | Customer Segments | Who are you creating value for? |
| Front Stage | Value Propositions | What problem are you solving? |
| Front Stage | Channels | How do you reach customers? |
| Front Stage | Customer Relationships | How do you interact and retain? |
| Front Stage | Revenue Streams | How do you earn money? |
| Back Stage | Key Activities | What do you need to do daily? |
| Back Stage | Key Resources | What assets do you need? |
| Back Stage | Key Partnerships | Who helps you operate? |
| Back Stage | Cost Structure | What are the major costs? |
Diving Deep Into the 9 Blocks 🔍
To use this tool effectively, each block requires specific attention. Below is a breakdown of what needs to be defined in each section.
1. Customer Segments 👥
Every business exists to serve a specific group. Identifying this group is the first step. You should not try to serve everyone. Define your segments clearly:
- Mass Market: Serving everyone without differentiation.
- Niche Market: Focusing on a specific group with specialized needs.
- Segmented: Dividing the market based on different needs.
- Multisided: Platforms that serve two or more interdependent groups.
For a startup, clarity here prevents wasted resources. An IPO-ready company often has a clearly defined core market with a path to expansion.
2. Value Propositions 🎯
This is the heart of the business. It describes the bundle of products and services that create value for a specific customer segment. Why would a customer choose you over a competitor?
- Innovation: Offering something new or better.
- Performance: Better product performance.
- Customization: Tailoring the solution to specific needs.
- Design: Aesthetics and usability.
- Price: Lower cost or better value for money.
As you grow, your value proposition may shift. Early on, it might be about accessibility. Later, it might be about reliability and scale.
3. Channels 📢
These are the touchpoints where customers interact with your company. Channels serve multiple functions:
- Raising awareness about products and services.
- Helping customers evaluate the value proposition.
- Allowing customers to purchase the product.
- Delivering the value proposition to the customer.
- Providing after-sales support.
Choosing the right mix of online and offline channels is crucial. As you scale, channel efficiency becomes a major cost driver.
4. Customer Relationships 🤝
This block describes the types of relationships a company establishes with specific customer segments. Relationships can range from automated to personal. Consider the following types:
- Personal Assistance: Direct interaction with humans.
- Self-Service: No direct interaction.
- Automated Services: Online tools and algorithms.
- Communities: Creating a user base that interacts.
- Co-creation: Users help create the value.
Retention strategies often hinge on this block. For an IPO, predictable recurring revenue is often more valued than one-time sales.
5. Revenue Streams 💰
This represents the cash a company generates from each customer segment. There are various ways revenue can be captured:
- Asset Sale: Selling ownership of a product.
- Usage Fee: Charging for service usage.
- Subscription Fees: Recurring payment for access.
- Lending/Renting/Leasing: Temporary access rights.
- Advertising: Fees for space or exposure.
Defining the pricing mechanism is vital. Some models rely on volume, others on high margins. The goal is to ensure the revenue covers the cost structure with a healthy margin.
6. Key Activities 🛠️
These are the most important things a company must do to make its business model work. The type of activity depends on the business model type:
- Production: Designing, making, and delivering products.
- Problem Solving: Providing new solutions for individual customer problems.
- Platform/Network: Maintaining and evolving the platform.
Early on, activities might focus on product development. Later, they shift to sales, operations, and compliance.
7. Key Resources 🏢
These are the assets required to offer and deliver the previously described elements. There are four categories:
- Physical: Buildings, vehicles, machines.
- Intellectual: Brands, patents, copyrights, data.
- Human: Team, culture, expertise.
- Financial: Cash, lines of credit, stock.
Investors often look at the Key Resources block to assess defensibility. Intellectual property or a strong talent pool can be a significant moat.
8. Key Partnerships 🤲
Many companies do not perform all activities in-house. They build a network of suppliers and partners to optimize their business model. Partnerships are motivated by:
- Optimization and Economy of Scale: Doing less work.
- Reducing Risk and Uncertainty: Sharing risks.
- Acquisition of Resources: Accessing what you lack.
Strategic alliances are common in scaling phases. Joint ventures allow access to new markets without full capital expenditure.
9. Cost Structure 💸
This describes all costs incurred to operate a business model. It helps determine the profitability of the model. Costs can be driven by:
- Cost-Driven: Minimizing costs wherever possible (Low-cost airlines).
- Value-Driven: Creating high value (Luxury brands).
Understanding fixed vs. variable costs is essential for financial modeling. IPO candidates must demonstrate predictable cost management.
The Evolution of the Canvas: From Idea to IPO 📈
The canvas is not static. It evolves as the company matures. Using the same canvas for a seed-stage startup as for a public company is a mistake. Here is how the focus shifts.
Phase 1: Ideation and Validation 🧪
In the beginning, the goal is to prove that a problem exists and that customers care. The canvas is used to identify risks.
- Focus: Value Proposition and Customer Segments.
- Action: Conduct interviews and build prototypes.
- Key Metric: Customer discovery and feedback loops.
At this stage, the Cost Structure is minimal. The Key Resources are primarily the founders’ time and knowledge. Partnerships are non-existent or very informal.
Phase 2: Early Growth and Funding 🏦
Once validation occurs, the focus shifts to acquiring users and refining the model. This is where Series A and B funding typically happen.
- Focus: Channels, Revenue Streams, and Key Activities.
- Action: Scale marketing, optimize sales funnels.
- Key Metric: Customer Acquisition Cost (CAC) and Lifetime Value (LTV).
Here, Key Resources shift towards technology infrastructure and talent. The Cost Structure grows as you hire more people. Partnerships become formal contracts.
Phase 3: Scaling and IPO Preparation 🏛️
Preparing for an IPO requires rigor, compliance, and predictable growth. The canvas must reflect operational stability.
- Focus: Cost Structure, Key Partnerships, and Customer Relationships.
- Action: Automate processes, ensure regulatory compliance.
- Key Metric: EBITDA, recurring revenue growth, churn rate.
Investors scrutinize the Cost Structure block for unit economics. They want to see that every additional dollar spent generates more than a dollar in revenue. The Key Partnerships block must show supply chain reliability. The Customer Relationships block must show high retention to prove market fit at scale.
Common Pitfalls When Using the Canvas ⚠️
Even with a powerful tool, founders often make mistakes. Avoid these common traps to ensure your strategy holds up under scrutiny.
- Being Too Vague: Writing “High quality” in the Value Proposition is not specific enough. Define what “high quality” means in measurable terms.
- Ignoring the Back Stage: Many founders focus only on what the customer sees (Front Stage) and forget how the business actually works (Back Stage). If Key Activities and Resources do not support the Value Proposition, the model will fail.
- Static Thinking: Treating the canvas as a one-time exercise. The market changes. The canvas should be reviewed quarterly.
- Overestimating Revenue: It is easy to fill the Revenue Streams box with optimistic numbers. Be conservative. Base projections on data from early experiments.
- Neglecting Costs: Focusing on how much you make while ignoring how much you spend is a fast track to failure. The Cost Structure block must be as detailed as the Revenue block.
BMC vs. Traditional Business Plans 📄
Traditionally, entrepreneurs wrote 50-page business plans. These documents are often static and filled with information that becomes obsolete quickly. The Business Model Canvas offers a dynamic alternative.
| Feature | Business Model Canvas | Traditional Business Plan |
|---|---|---|
| Length | One Page | 30 to 50 Pages |
| Flexibility | High (Easy to change) | Low (Hard to update) |
| Focus | Strategy & Logic | Documentation & Compliance |
| Visuals | Visual Diagram | Text Heavy |
| Iteration | Continuous | One-time |
While the Canvas is superior for strategy, some investors still request traditional plans for due diligence. The ideal approach is to use the Canvas for internal strategy and team alignment, and the business plan for formal documentation when required.
Metrics for IPO Readiness Linked to the Canvas 📊
As you move toward an Initial Public Offering, the metrics you track must align with the blocks of your canvas. Public markets demand transparency and predictability.
- From Customer Segments: Market Share and Growth Rate. Investors need to know the Total Addressable Market (TAM) is large enough.
- From Revenue Streams: Gross Margin and Net Revenue Retention. These show profitability and customer loyalty.
- From Cost Structure: Burn Rate and Runway. How long can you survive without new funding?
- From Key Resources: Intellectual Property Portfolio. Patents and trademarks protect future revenue.
- From Key Partnerships: Supplier Concentration. Relying on one supplier is a risk for public companies.
Iterating the Model for Sustainability 🔄
Strategy is not a destination; it is a journey. As you iterate the canvas, you should ask specific questions to drive improvement.
- Can we reduce costs? Look at the Cost Structure. Can automation lower Key Activities costs?
- Can we increase revenue? Look at the Revenue Streams. Can we introduce a tiered pricing model?
- Can we reach more customers? Look at Channels. Are there new digital channels to exploit?
- Can we improve retention? Look at Customer Relationships. Is there a way to increase switching costs?
This iterative process keeps the business agile. It prevents the “build it and they will come” fallacy. By constantly checking the canvas against reality, you ensure the model remains viable.
Final Thoughts on Building for the Long Term 🌟
The path from a garage idea to a publicly traded company is arduous. It requires discipline, data, and a clear strategic vision. The Business Model Canvas provides the structure needed to navigate this complexity without losing sight of the core value.
By understanding the nine blocks and how they interact, you can identify weaknesses before they become fatal flaws. By evolving the canvas through the stages of growth, you ensure that your strategy scales with your operations.
Remember that the canvas is a tool for thinking, not just a document to file away. Use it to challenge assumptions, test hypotheses, and align your team. When the time comes to present to the public market, the clarity you built on this canvas will be evident in your financial statements and strategic roadmap.
Start with the customer. Work backward to the resources. Ensure the math works. This is the essence of building a viable, scalable, and enduring enterprise.