Designing robust software systems requires a clear understanding of how components interact. While static models define structure, dynamic models reveal behavior. Among the dynamic modeling techniques, the Communication Diagram stands out for its ability to visualize object relationships and message flows simultaneously. This guide explores the mechanics of constructing complex interactions using this notation, ensuring clarity for developers and stakeholders alike.
Unlike linear sequences, these diagrams emphasize the structural topology of the system. They map the connections between objects, making it easier to trace the path of data across a network of components. By mastering the visual syntax, architects can identify bottlenecks and logical gaps before implementation begins.
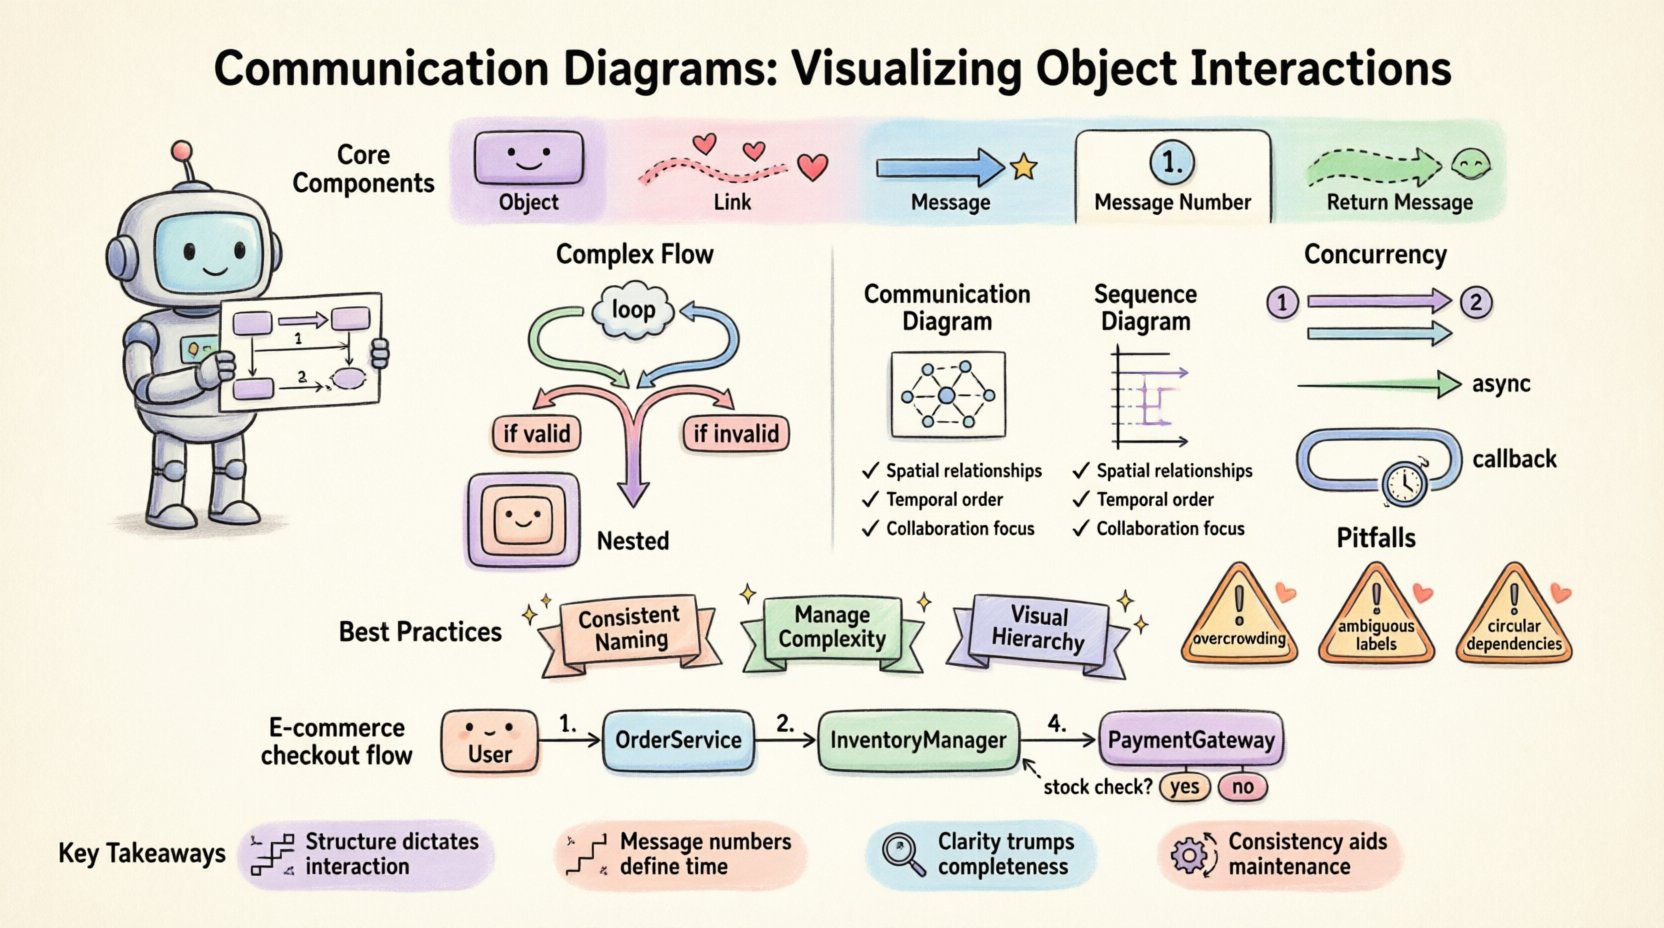
🔍 Understanding the Core Components
A Communication Diagram is a form of interaction diagram within the Unified Modeling Language (UML). It focuses on the organization of objects and the messages exchanged between them. To build effective diagrams, one must understand the fundamental building blocks.
- Objects: These represent instances of classes or specific roles within the system. They are depicted as rectangles with the name of the object or class.
- Links: These represent the structural relationships between objects. A line connects two objects, indicating they can communicate directly.
- Messages: These are the actions or data transfers sent from one object to another. They are drawn as arrows along the links.
- Message Numbers: A sequence identifier (1, 1.1, 2) indicates the order of execution. This provides the temporal aspect to the structural view.
- Return Messages: Often shown as dashed arrows, these indicate a response from the receiver back to the sender.
When drawing these diagrams, clarity is paramount. Avoid crossing lines where possible, as visual clutter obscures the logic. Group related objects together to maintain a logical flow.
🧩 Modeling Complex Control Flow
Simple request-response patterns are easy to represent. Real-world systems, however, involve loops, conditions, and branching logic. Handling these complexities requires specific notations to ensure the diagram remains readable.
1. Iteration and Loops
When an object sends multiple messages to the same recipient, or performs an action repeatedly, use loop fragments. Instead of drawing ten identical arrows, denote the action with a label indicating the repetition count or condition.
- Use Case: Processing a list of transactions.
- Notation: Add a note or text label saying “loop” or “iterate” near the arrow.
- Benefit: Reduces visual noise and highlights the repetitive nature of the logic.
2. Conditional Logic
Systems often branch based on state. A user might trigger different workflows depending on their authentication status. In a Communication Diagram, this is represented by multiple arrows originating from the same point but labeled with distinct conditions.
- Condition A: Label the arrow “if valid”.
- Condition B: Label the arrow “if invalid”.
- Visual Separation: Ensure these paths diverge clearly to avoid confusion about which path is taken.
3. Nested Interactions
Complex systems often involve layers of abstraction. An object might delegate a task to another object, which in turn calls a third party. This creates a chain of dependencies. Use nesting or distinct groups to separate these layers.
- Grouping: Visually group objects that belong to the same subsystem.
- Scope: Ensure the scope of the diagram matches the level of detail required. Do not mix high-level API calls with low-level database queries in a single view.
⚡ Handling Concurrency and Asynchronous Flow
Modern architectures frequently rely on asynchronous processing. Messages are sent without waiting for an immediate response. This changes the dynamic of the interaction diagram.
When modeling concurrency:
- Parallel Arrows: Draw arrows that start from the same source but go to different destinations at the same time. Use message numbers like “1” and “2” to indicate they happen concurrently.
- Fire-and-Forget: Represent asynchronous calls with a specific arrowhead style (often an open arrowhead) to distinguish them from synchronous calls.
- Callbacks: If an asynchronous process triggers a callback later, show this as a separate message flow returning to the original sender, labeled with a later message number.
Understanding the timing implications is crucial. While the diagram shows structure, the message numbers imply time. If message 1 is asynchronous, message 2 might occur before the response to 1 is received. Documenting this expectation prevents runtime errors.
📊 Communication Diagram vs. Sequence Diagram
Choosing the right tool depends on the information you need to convey. Both diagrams show interactions, but they prioritize different aspects. The table below clarifies when to use a Communication Diagram over a Sequence Diagram.
| Feature | Communication Diagram | Sequence Diagram |
|---|---|---|
| Primary Focus | Object relationships and structural links | Time ordering and message sequence |
| Visual Layout | Space-oriented; objects placed based on connections | Time-oriented; vertical axis represents time |
| Complexity | Better for complex object networks | Better for detailed timing scenarios |
| Readability | Requires careful layout to avoid crossing lines | Linear flow makes it easier to follow chronologically |
| Message Numbers | Explicit numbers (1, 1.1, 2) define order | Vertical position implies order naturally |
Use Communication Diagrams when the topology of the system matters more than the exact millisecond timing. Use them to explain how components are wired together.
🛡️ Best Practices for Clarity
Creating a diagram is only half the battle. Maintaining its accuracy and readability over time is essential. Adhering to established conventions ensures that team members can interpret the model without ambiguity.
1. Consistent Naming Conventions
- Object Names: Use noun phrases (e.g., “UserRepository”, “OrderHandler”).
- Message Names: Use verb phrases (e.g., “calculateTotal”, “saveRecord”).
- Roles: If an object plays multiple roles, label the link with the role name (e.g., “Client”, “Server”).
2. Managing Message Complexity
Not every interaction needs to be drawn. If a subsystem handles internal logic that does not cross boundaries, do not detail it in the high-level diagram. Focus on the boundaries of the components.
- Summarize: Use a single message to represent a complex internal process.
- Expand: Only expand internal logic if it reveals a critical failure point or performance bottleneck.
3. Visual Hierarchy
Use size and positioning to indicate importance. Primary objects should be central. Peripheral objects should be placed outward. This mirrors the data flow from the core service to external dependencies.
🚨 Common Pitfalls to Avoid
Even experienced architects make mistakes when modeling interactions. Recognizing these common errors helps maintain high standards.
- Circular Dependencies: If Object A calls Object B, and Object B calls Object A, check if this indicates a design flaw. While valid in some patterns, it often signals tight coupling.
- Overcrowding: Putting too many objects on one page makes the diagram unreadable. Split the model into logical sections or subsystems.
- Ambiguous Message Labels: Avoid generic terms like “process” or “handle”. Be specific about what is happening (e.g., “validateToken”).
- Ignoring Return Paths: Forgetting to show return messages can hide potential blocking issues. If a response is critical, show it explicitly.
- Inconsistent Notation: Stick to the standard UML arrow types. Mixing open, closed, and dashed arrows without a legend confuses the reader.
🔄 Evolution and Maintenance
Software changes. Requirements shift. The diagrams must evolve alongside the code. Treating these diagrams as living documents prevents technical debt.
When updating a diagram:
- Review Links: Ensure every object on the diagram exists in the current architecture.
- Check Message Flow: Verify that new features have been added to the interaction flow.
- Version Control: Store diagram files alongside the source code repository. This ensures traceability between design and implementation.
- Documentation Sync: If the diagram changes, update the accompanying API documentation to reflect new endpoints or parameters.
🚀 Advanced Scenarios: Microservices and Distributed Systems
As systems move toward distributed architectures, the complexity of interactions increases. Communication Diagrams remain valuable but require adaptation.
Network Boundaries: Clearly distinguish between internal calls and network calls. Use different link styles or colors to indicate network latency expectations.
Service Discovery: In dynamic environments, objects may not have fixed addresses. Represent this by noting that the link is established via a service registry.
Failure Handling: Explicitly model error paths. What happens if the database is unreachable? Add a branch for “timeout” or “error” to show how the system degrades gracefully.
📝 Practical Application: A Step-by-Step Construction
To illustrate the process, consider building a diagram for an e-commerce checkout flow. Follow these steps to ensure accuracy.
- Identify Actors: Start with the external user and the internal system entry point.
- Define Core Objects: Add the OrderService, InventoryManager, and PaymentGateway.
- Draw Links: Connect the OrderService to Inventory and Payment.
- Sequence Messages: Number the flow. 1. Place Order, 1.1. Check Stock, 1.2. Process Payment.
- Add Conditions: Add a branch if stock is insufficient.
- Refine: Remove unnecessary internal calls that do not affect the flow.
This systematic approach ensures that no critical interaction is overlooked. It forces the designer to think about the connections, not just the actions.
🎯 Summary of Key Takeaways
Effective communication diagrams bridge the gap between abstract design and concrete implementation. They provide a spatial view of system dynamics that complements temporal views. By focusing on object links and message ordering, teams can visualize complex logic without getting lost in code.
Remember these core principles:
- Structure dictates interaction.
- Message numbers define time.
- Clarity trumps completeness.
- Consistency aids maintenance.
Apply these techniques to your next system design. Start small, document the critical paths, and expand as the system grows. The investment in clear diagrams pays off during debugging and onboarding new team members.