Software systems grow complex over time. As codebases expand, the relationships between different components become harder to track. Understanding how modules interact is critical for maintainability and scalability. Package diagrams provide a high-level view of these structures. They visualize the organization of code into logical groups. This guide outlines how to document dependencies effectively. We focus on clarity, accuracy, and long-term value.
When developers can see the architecture at a glance, they make better decisions. They understand where changes will ripple through the system. This documentation acts as a map for navigation. It reduces the risk of introducing bugs during refactoring. Proper documentation supports collaboration across teams. It ensures that everyone shares the same mental model of the system.
🧠 Understanding the Role of Package Diagrams
A package diagram represents the static structure of a software system. It groups elements into packages based on functionality or domain. Each package encapsulates a set of related classes, interfaces, or modules. The diagram highlights the dependencies between these packages. It does not show internal implementation details. Instead, it focuses on the boundaries and contracts.
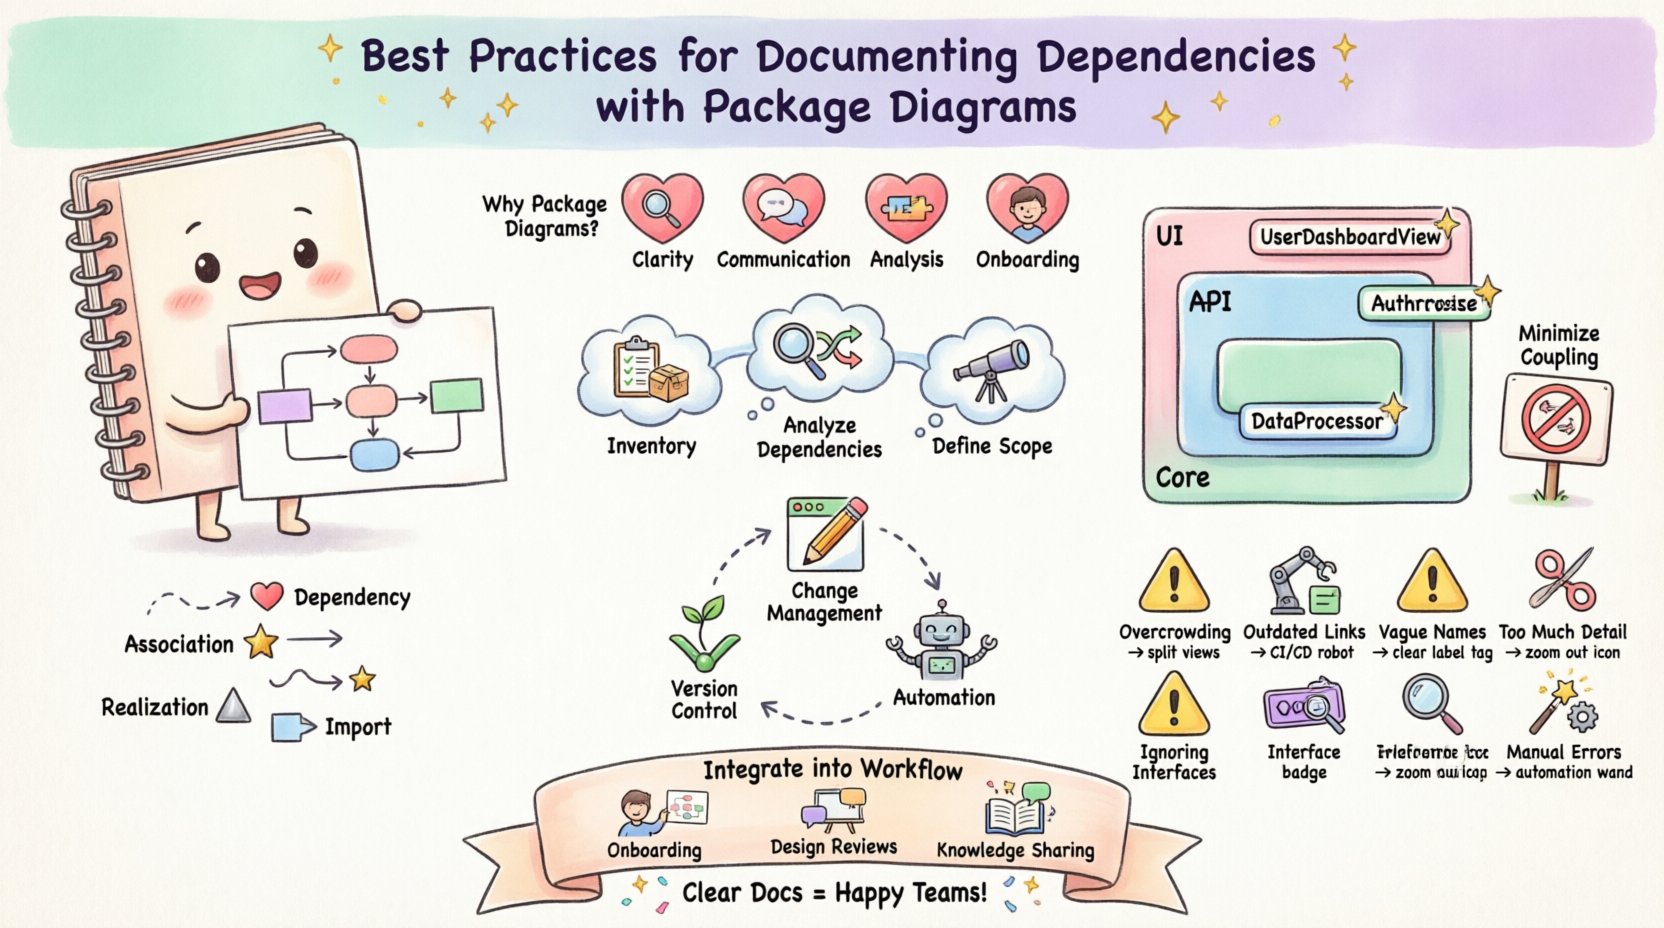
- Clarity: It simplifies complex systems into manageable units.
- Communication: It serves as a common language for architects and developers.
- Analysis: It helps identify coupling issues and circular dependencies.
- Onboarding: New team members can grasp the system layout quickly.
Without this documentation, the system becomes a black box. Changes become risky because the impact is unknown. Dependencies might be hidden in deep folder structures. Explicitly mapping them brings these connections into the light. This practice is essential for large-scale enterprise applications.
📋 Preparing for Accurate Documentation
Before drawing any lines or boxes, preparation is key. Accurate diagrams rely on accurate data. You must understand the current state of the codebase. This involves inventorying existing modules and understanding their purposes.
1. Inventorying System Modules
Start by listing all available packages in the project. Use the file system or build tools to extract this list. Group them by their primary responsibility. For example, separate data access from business logic. This logical separation makes the diagram easier to read.
- Identify core domains within the application.
- Group related classes into logical containers.
- Verify that every module has a defined purpose.
- Remove or merge redundant or unused packages.
2. Analyzing Existing Dependencies
Once you have the modules, map how they talk to each other. Use automated analysis tools to scan imports and references. This reveals the actual dependency graph. Manual inspection alone often misses hidden connections.
- Scan for direct import statements.
- Check for indirect dependencies via interfaces.
- Identify circular references between packages.
- Note any framework-specific constraints.
3. Defining the Scope
Not every diagram needs to show everything. A system might be too large for a single view. Define the scope of the documentation. Focus on specific subsystems if necessary. This keeps the information digestible.
- Choose a level of abstraction appropriate for the audience.
- Focus on high-level flows for stakeholders.
- Include detailed internal links for developers.
- Ensure consistency across multiple diagrams.
🎨 Structuring the Visual Representation
How you arrange the packages matters. A well-organized diagram aids comprehension. Chaos in layout reflects chaos in the code. Follow established conventions for spatial arrangement.
1. Hierarchy and Grouping
Use nesting to show containment. Larger packages should contain smaller sub-packages. This creates a clear tree structure. It helps users drill down from general to specific.
- Place general domain packages at the top.
- Group technical layers (e.g., UI, API, Core) separately.
- Keep related features together in the same container.
- Avoid scattering related components across the canvas.
2. Naming Conventions
Names on the diagram should match the code. Consistency reduces cognitive load. If a package is called AuthService in code, label it the same way in the diagram. Ambiguous names lead to confusion.
- Use full, descriptive names for packages.
- Avoid abbreviations unless they are standard industry terms.
- Ensure names reflect the content accurately.
- Update names immediately when code changes.
3. Visual Consistency
Use consistent shapes and colors. Do not mix styles arbitrarily. Style choices should convey meaning. For example, use specific colors for different architectural layers.
- Define a style guide for the documentation.
- Apply the same font sizes and styles.
- Use borders to distinguish package boundaries clearly.
- Keep the layout clean and uncluttered.
🔗 Managing Dependency Relationships
The lines connecting packages tell the story of data flow. These relationships must be documented precisely. Misrepresenting a dependency can lead to serious errors.
1. Types of Connections
Different arrows indicate different types of usage. Distinguish between strong and weak coupling.
- Dependency: One package requires another to function.
- Association: A package holds a reference to another.
- Realization: One package implements the interface of another.
- Import: One package exposes functionality to others.
2. Minimizing Coupling
High coupling makes systems fragile. If one package changes, many others break. The diagram should highlight these tight links. Use it to identify areas for decoupling.
- Aim for dependencies to flow in one direction.
- Avoid circular dependencies between major packages.
- Use interfaces to reduce concrete dependencies.
- Introduce dependency injection where appropriate.
3. Documenting Exports
Not everything in a package is public. Define what is exported and what is internal. This clarifies the contract between modules.
- Mark public interfaces clearly on the diagram.
- Hide implementation details unless necessary.
- Document the API surface for each package.
- Update export lists when APIs change.
🔄 Maintenance and Evolution
Documentation is not a one-time task. Systems evolve, and diagrams must follow. Outdated documentation is worse than no documentation. It creates false expectations and confusion.
1. Version Control Integration
Store diagrams alongside the code. Keep them in the same repository. This ensures they are versioned together. When code moves, the diagram moves with it.
- Commit diagrams with code changes.
- Link diagram versions to release tags.
- Review diagrams during code review processes.
- Automate generation if possible to reduce drift.
2. Change Management
When a package is refactored, update the diagram. Do not wait for a quarterly review. Immediate updates ensure the map remains accurate.
- Assign ownership of diagram updates to team leads.
- Check the diagram before merging large changes.
- Notify stakeholders of significant structural shifts.
- Archive old versions for historical reference.
3. Automation Strategies
Manual maintenance is prone to error. Consider tools that generate diagrams from code. These tools scan the source and produce visuals. They reduce the burden on human editors.
- Use static analysis to detect dependencies.
- Configure generation scripts for regular builds.
- Validate generated output against manual edits.
- Ensure the generated output is human-readable.
⚠️ Common Pitfalls and Solutions
Many teams struggle with package diagrams. They often fall into common traps. Recognizing these pitfalls helps avoid them.
| Pitfall | Impact | Best Practice Solution |
|---|---|---|
| Overcrowding | Diagram becomes unreadable. | Split into multiple views by layer or feature. |
| Outdated Links | Confusion during navigation. | Integrate updates into the CI/CD pipeline. |
| Vague Names | Misunderstanding of purpose. | Enforce strict naming conventions. |
| Ignoring Interfaces | Hidden coupling risks. | Explicitly model interface implementations. |
| Too Much Detail | Loss of high-level context. | Keep diagrams at the package level, not class level. |
| Manual Errors | Inaccurate dependency maps. | Use automated generation tools where possible. |
🚀 Integrating into the Development Lifecycle
Documentation should not sit in a static folder. It must be part of the workflow. Teams that ignore it often face technical debt.
1. Onboarding Processes
Use diagrams to introduce new hires. Let them study the package structure before coding. This accelerates their time to productivity.
- Include diagrams in the onboarding pack.
- Walk through the architecture during orientation.
- Encourage questions about package boundaries.
- Use diagrams as a reference during pair programming.
2. Design Reviews
Present package diagrams during architecture reviews. Discuss the proposed changes visually. This ensures the team agrees on the structure.
- Show the current state before proposing changes.
- Highlight new dependencies in the proposal.
- Get sign-off on structural changes.
- Update the diagram immediately after approval.
3. Knowledge Sharing
Use diagrams to explain system constraints. They are better than text for spatial relationships. Share them in internal wikis or documentation portals.
- Host diagrams in a central knowledge base.
- Ensure they are accessible to all developers.
- Keep descriptions concise and clear.
- Link diagrams to relevant API documentation.
🛡️ Conclusion
Documenting dependencies with package diagrams is a discipline. It requires effort to maintain accuracy. However, the return on investment is significant. Teams gain visibility into their systems. Risks are reduced, and changes are safer. This practice supports sustainable software development.
Start by analyzing your current structure. Identify the main packages and their links. Create the initial diagram using clear conventions. Commit to keeping it updated. Over time, this habit becomes second nature. The system becomes easier to understand and modify.
Investing in clear architecture documentation pays dividends. It reduces the friction of daily work. Developers spend less time guessing and more time building. This approach fosters a culture of quality. It ensures the system remains robust as it grows.
Remember that the goal is communication. The diagram is a tool for sharing knowledge. Use it to bridge gaps between team members. Ensure that the visual representation matches the reality of the code. When these align, the team operates with confidence.