Modern financial infrastructure relies on complex interactions between disparate systems. From a simple balance inquiry to a multi-million dollar wire transfer, every action triggers a chain of events. To visualize these interactions effectively, architects and developers turn to Unified Modeling Language (UML) diagrams. Specifically, Communication Diagrams offer a unique perspective on object interactions that is crucial for understanding high-stakes banking environments. This guide explores how to map these flows using real-world scenarios, ensuring clarity without relying on specific tooling.
Understanding the Communication Diagram in Finance 🧩
A Communication Diagram, formerly known as a Collaboration Diagram, focuses on the structural organization of objects and their connections. Unlike Sequence Diagrams, which emphasize time ordering, Communication Diagrams highlight the relationships between objects. In banking, where multiple services must coordinate instantly, knowing who talks to whom is often more critical than knowing the exact millisecond of delivery.
When modeling a banking transaction, you are essentially mapping the lifecycle of a request as it traverses the system boundaries. This includes:
- Client Applications (Mobile, Web, Kiosk) 📱
- API Gateways and Load Balancers ⚖️
- Core Banking Engines ⚙️
- Payment Switches and Clearing Houses 🏦
- External Third-Party Services (Credit Bureaus, Fraud Checkers) 🔒
Each of these components acts as a node in the diagram. The lines connecting them represent the communication channels, while the labels on the lines describe the messages passed. This structural view helps identify bottlenecks, single points of failure, and security vulnerabilities before code is written.
Why Communication Diagrams? 🤔
Choosing the right visualization tool impacts how a team understands the system. For banking transaction flows, Communication Diagrams offer specific advantages:
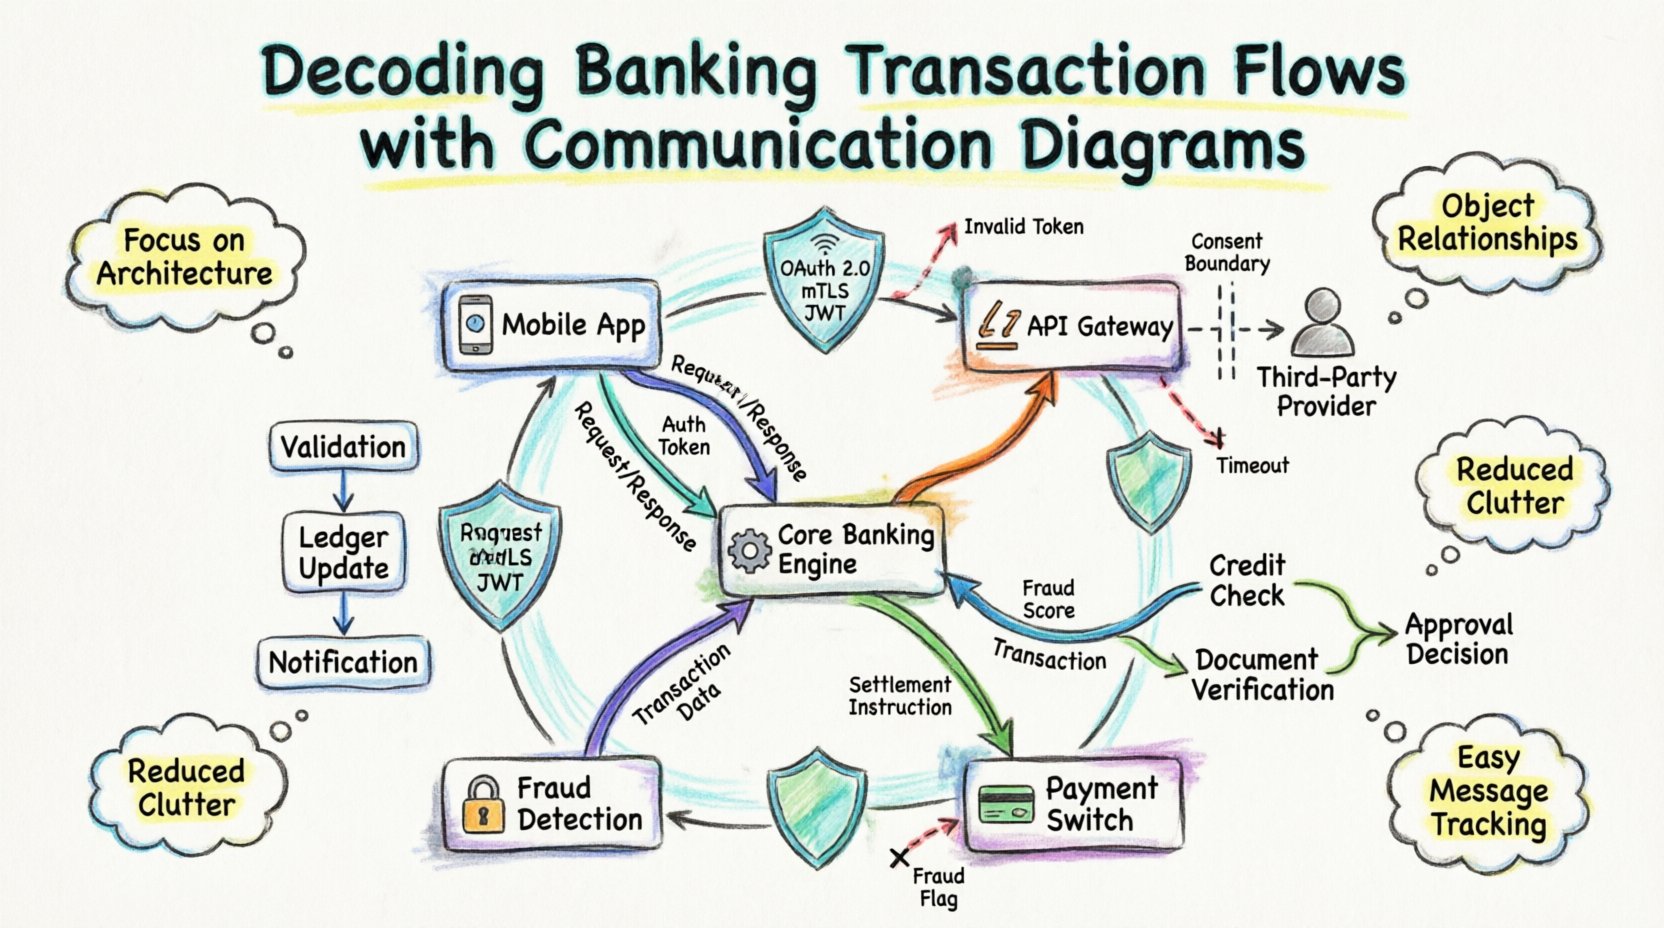
- Focus on Architecture: They reveal the topology of the system. You can see if a request must hop through five services or if it can be routed directly.
- Object Relationships: Banking systems are object-oriented. This diagram type maps objects (e.g.,
Account,Transaction,Customer) directly to their interactions. - Reduced Clutter: In complex workflows with many participants, Sequence Diagrams can become vertically long and hard to read. Communication Diagrams condense this information into a network view.
- Message Identification: It is easy to spot all messages sent to a specific service by looking at the lines connected to that node.
Anatomy of a Financial System Diagram 🛠️
To build an accurate representation, one must understand the standard elements used in these diagrams. While specific notations may vary, the core concepts remain consistent.
1. Object Nodes
These are the rectangles representing system components. In a banking context, these are rarely physical servers but rather logical services. Examples include:
- Customer Profile Service: Handles authentication and personal data.
- Account Ledger Service: Manages balances and transaction history.
- Fraud Detection Engine: Analyzes patterns for anomalies.
- Notification Service: Sends SMS or email alerts.
2. Links
These are the lines connecting the object nodes. They represent the physical or logical network paths. In a secure banking environment, these links are often encrypted channels. The diagram should indicate if the communication is synchronous (blocking) or asynchronous (non-blocking).
3. Message Labels
Arrows on the links carry the message names and parameters. A label might read validateUser(credentials) or debitAccount(amount, currency). Including the return value in the label helps clarify the data flow.
4. Navigation Paths
Communication diagrams allow you to specify the order of message sending using numbers. For example, message 1.0 might be the initial request, and 2.0 might be the response from a subordinate service. This numbering is optional but helpful for tracing logic.
Comparing Diagram Types for Banking 📊
It is important to understand when to use a Communication Diagram over other UML types. The table below outlines the differences.
| Feature | Communication Diagram | Sequence Diagram | Activity Diagram |
|---|---|---|---|
| Primary Focus | Object relationships and topology | Time ordering of messages | Workflow and logic flow |
| Best For | Understanding system architecture | Debugging timing issues | Business process logic |
| Complexity | Can handle many participants easily | Can become very tall with many objects | Good for conditional logic |
| Banking Use Case | High-level service mapping | API endpoint debugging | Loan approval workflows |
Case Study 1: Peer-to-Peer Fund Transfer 💸
Let us examine a common scenario: a customer initiating a fund transfer between two accounts. This process involves validation, ledger updates, and notifications.
Step 1: Initiation and Validation
The Mobile App (Client) sends a request to the Transaction Gateway. The Gateway forwards this to the Account Ledger Service. Before any money moves, the system must verify the source account status.
- Message:
checkAccountStatus(accountId) - Response:
status = ACTIVE
Simultaneously, the Fraud Detection Engine is contacted. This is a critical parallel step to ensure security does not compromise speed.
- Message:
analyzeRisk(transactionData) - Response:
riskScore = LOW
Step 2: The Ledger Update
Once validations pass, the Account Ledger Service executes the debit and credit operations. This is the heart of the banking system.
- Message:
debitSourceAccount(amount) - Message:
creditDestinationAccount(amount)
The diagram must show that these two operations are part of a transactional boundary. If the credit fails after the debit, the system must roll back. The Communication Diagram helps visualize this dependency.
Step 3: Notification and Logging
After the financial state changes, the system updates the audit logs and notifies the user.
- Message:
logTransaction(record) - Message:
sendNotification(userToken)
By mapping this out, you can see that the Notification Service is not a dependency for the money moving. It is a side effect. This distinction is vital for system resilience.
Case Study 2: Third-Party Payment Initiation (Open Banking) 🌐
Open Banking regulations allow third-party providers to access customer data with consent. This introduces external actors into the communication flow. The diagram changes significantly here.
External Actors
In this scenario, the Third-Party Provider (TPP) acts as the initiator, not the end user’s app. The bank acts as the Account Servicing Party.
Flow Breakdown
- Consent Verification: The TPP requests access. The Consent Management Service validates the token and scope.
- Data Retrieval: The TPP requests transaction history. The Account Data Service queries the ledger.
- Aggregation: The Data Aggregator formats the response according to Open Banking standards (e.g., JSON Schema).
- Response: Data is sent back to the TPP.
A Communication Diagram here highlights the trust boundaries. The line between the Bank and the TPP represents a public API, requiring strict authentication headers. The internal line between the Aggregator and the Ledger is internal, requiring less overhead but higher security.
Case Study 3: Loan Application Processing 📝
Loan processing is asynchronous and often involves human approval or external checks. This makes it a great candidate for a Communication Diagram to show the orchestration.
Key Participants
- Loan Origination System (LOS)
- Credit Bureau API
- Document Verification Service
- Underwriting Engine
Interaction Sequence
- Submission: Customer submits application via LOS.
- Parallel Checks:
- LOS requests Credit Score from Credit Bureau API.
- LOS requests ID Verification from Document Service.
- Decision Point: The Underwriting Engine waits for both results.
- Outcome:
- If Pass: Engine approves and triggers Fund Disbursement Service.
- If Fail: Engine sends rejection to LOS.
The diagram clarifies the wait states. The LOS does not block indefinitely; it receives callbacks or polls for status. This architectural pattern is visible in the connections between the services.
Handling Exceptions and Error Flows ⚠️
A robust diagram must include failure paths. Banking systems cannot assume success. Every message flow needs an associated error handler visualization.
Common Failure Scenarios
- Network Timeout: The API Gateway receives no response from the Core Ledger.
- Insufficient Funds: The Ledger rejects the debit request.
- Invalid Token: The Fraud Engine rejects the authentication.
Visualizing Errors
In the diagram, error paths can be represented by dashed lines or distinct colors. For example, a dashed arrow from the Core Ledger back to the API Gateway labeled error = INSUFFICIENT_FUNDS. This ensures developers know that the error message must be caught and translated into a user-friendly notification.
Consider the impact of a cascading failure. If the Notification Service goes down, should the transaction proceed? The Communication Diagram helps answer this by showing dependencies. If the notification is not on the critical path, the diagram shows it can be retried later without blocking the money movement.
Security Considerations in Diagramming 🔐
Security is paramount in banking. When drawing these diagrams, you are implicitly designing the security perimeter.
Authentication Layers
Every external-facing link should be annotated with security protocols. For example:
- OAuth 2.0: Used for user session management.
- mutual TLS (mTLS): Used for service-to-service communication.
- JWT: Used for passing identity context.
Data Encryption
While the diagram does not show encryption keys, it should indicate where data is sensitive. Messages containing PII (Personally Identifiable Information) or PAN (Primary Account Numbers) should be flagged. A label like encrypt(PAN) on the message arrow reminds developers to apply encryption at the application layer.
Best Practices for Maintenance 🔄
Banking systems evolve. Regulations change, and features are added. The diagrams must stay current to remain useful.
- Version Control: Store diagrams alongside the codebase. If the API changes, the diagram should be updated in the same commit.
- Automated Generation: Where possible, generate diagrams from API definitions (like Swagger/OpenAPI). This reduces manual errors.
- Role-Specific Views: Create different versions of the diagram for different teams. Developers need technical details (endpoints, payloads). Architects need logical flows (services, data stores).
- Regular Audits: Review diagrams quarterly. Ensure that deprecated services are removed from the visual map.
Common Pitfalls to Avoid 🚫
Even with a good tool, mistakes happen. Here are common errors in banking communication diagrams.
1. Ignoring Asynchrony
Banking systems are often event-driven. Assuming all calls are synchronous leads to incorrect timeout configurations. Use distinct arrow styles or labels to denote asynchronous events (e.g., event: PAYMENT_COMPLETED).
2. Over-Complicating the View
Do not try to map every single internal function call in a single diagram. If a service has 50 internal methods, group them. Focus on the interface exposed to other services.
3. Missing State Changes
A transaction changes the state of the system (e.g., Balance goes from 100 to 90). The diagram should indicate state transitions where possible, perhaps by noting the state change on the return arrow.
4. Lack of Context
Don’t forget the user. The diagram often starts at the API Gateway. However, adding the User or Client App as the root node provides context for latency and user experience expectations.
Final Thoughts on System Design 🎯
Creating these diagrams is not just about documentation; it is about communication. It bridges the gap between business requirements and technical implementation. When a developer reads a Communication Diagram for a banking transaction, they should understand the trust model, the data flow, and the failure points without reading the code.
By focusing on the relationships between objects, you build a mental model that scales. Whether you are designing a new payment gateway or auditing an existing loan system, the clarity provided by these visualizations reduces risk and improves delivery speed. The goal is a system that is transparent, secure, and resilient.
Remember, the diagram is a living artifact. It should evolve as the system does. Regular updates ensure that the team always has a single source of truth regarding how money moves through the digital infrastructure.