The Business Model Canvas is often viewed as a static grid, a one-page snapshot of how an organization creates, delivers, and captures value. However, treating it as a fixed diagram can lead to strategic blindness. To truly leverage this framework, one must examine the dynamic currents flowing between its components. These currents form interconnected loops that determine resilience, scalability, and profitability. This guide dissects those loops, offering a granular look at how value flows through the organization and how feedback mechanisms sustain long-term viability.
Understanding the Framework as a System 🔄
At its core, the canvas is a tool for mapping relationships. It visualizes the logic of a business. When analyzing the interconnected loops, we shift focus from individual blocks to the pathways connecting them. A change in one area inevitably ripples through the others. For instance, altering the cost structure impacts the pricing strategy, which in turn influences customer perception and revenue generation.
- Static View: Focusing on filling out the nine blocks correctly.
- Dynamic View: Understanding how adjustments in one block trigger changes in adjacent or distant blocks.
- Strategic View: Using the loops to test hypotheses and validate assumptions before committing resources.
This systemic approach requires patience and rigorous analysis. It is not about quick fixes but about establishing a robust architecture capable of withstanding market shifts.
The Nine Building Blocks: A Deeper Look 🔍
Before dissecting the loops, we must briefly define the components that comprise the canvas. Each block serves a specific function, acting as a node in the larger network.
1. Customer Segments 👥
Who are we creating value for? This block defines the distinct groups of people or organizations the enterprise aims to reach and serve. Identifying these segments is the foundation. Without a clear definition, the rest of the model lacks direction.
- Mass markets vs. niche markets.
- B2B vs. B2C dynamics.
- Multi-sided platforms requiring multiple segments.
2. Value Propositions 💡
What bundle of products and services creates value for a specific customer segment? This is the core reason why customers turn to one company over another. It must solve a problem or satisfy a need.
- Newness, performance, customization.
- Design, brand/status, price, cost reduction.
- Risk reduction, accessibility, convenience.
3. Channels 🚀
How does the value proposition reach the customer? Channels are touchpoints through which companies interact with customers. They influence customer experience and are crucial for value delivery.
- Owned channels (website, sales force).
- Partner channels (retailers, distributors).
- Hybrid models combining direct and indirect access.
4. Customer Relationships 🤝
What type of relationship does each customer segment expect? This block defines the nature of the interaction, ranging from personal assistance to automated services.
- Purchase completion.
- After-sales support.
- Community building and self-service.
5. Revenue Streams 💰
What value are customers willing to pay for? This block represents the cash a company generates from each customer segment. Pricing mechanisms and revenue models vary widely.
- Asset sale, usage fee, subscription fees.
- Leasing, licensing, brokerage fees.
- Advertising-based models.
6. Key Resources 🏗️
What assets are required to make the business model work? These are the physical, intellectual, human, and financial resources needed to create and offer a value proposition.
- Physical (buildings, machines).
- Intellectual (brands, patents, data).
- Human (skilled labor, expertise).
- Financial (cash, lines of credit).
7. Key Activities 🛠️
What strategic actions must the company perform? These are the most important things a company must do to make its business model work.
- Production (designing, making, delivering).
- Problem solving (consulting, healthcare).
- Platform/network (software, exchanges).
8. Key Partnerships 🤝
Who are our key suppliers and partners? This block outlines the network of suppliers and partners that make the business model work.
- Strategic alliances between non-competitors.
- Co-opetition (strategic partnerships between competitors).
- Joint ventures to develop new businesses.
- Outsourcing and buyer-supplier relationships.
9. Cost Structure 💸
What are the most important costs inherent in the business model? This block describes all costs incurred to operate a business model.
- Cost-driven (lowest price, minimal overhead).
- Value-driven (premium products, high service).
- Fixed costs vs. variable costs.
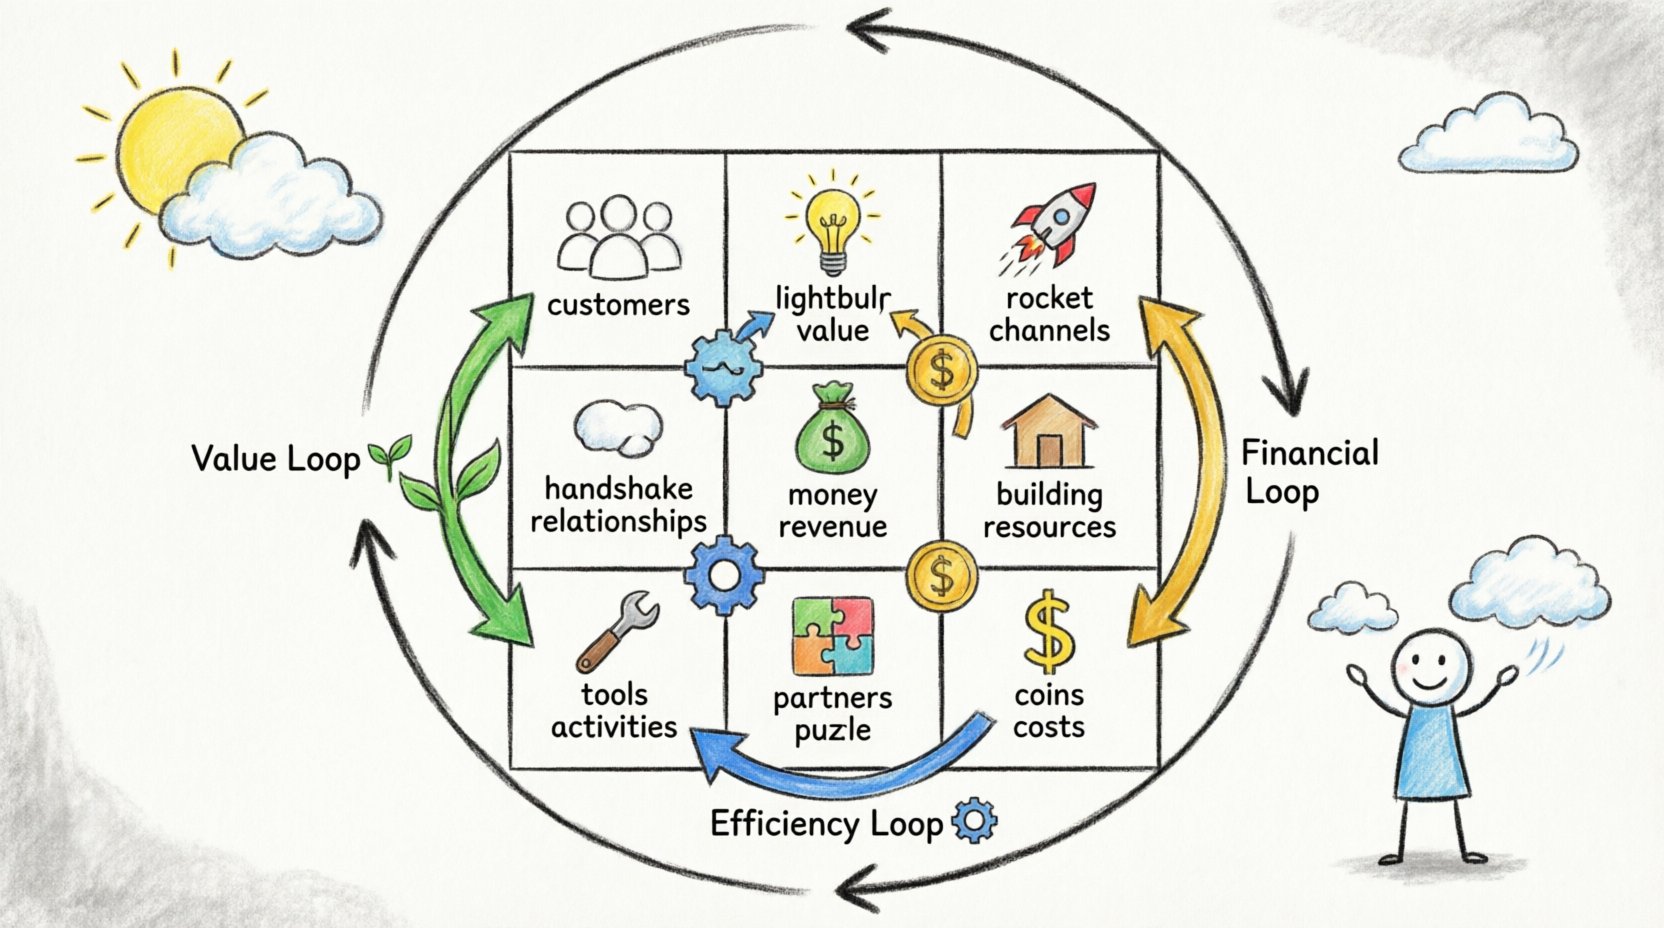
Mapping the Critical Loops 🔗
The true power of the canvas lies in the connections between these blocks. We can categorize these connections into three primary loops: the Value Loop, the Efficiency Loop, and the Feedback Loop.
1. The Value Creation Loop 🌱
This loop connects Customer Segments, Value Propositions, Channels, and Customer Relationships. It answers the question: How do we get the right solution to the right person?
- Segment to Proposition: The value proposition must directly address the pain points or gains of the specific segment. If the segment changes, the proposition must evolve.
- Proposition to Channels: The channel must be accessible to the segment. A luxury proposition requires high-touch channels; a mass-market proposition requires efficient, scalable channels.
- Channels to Relationships: The channel often dictates the relationship type. An automated app implies self-service, while a dedicated account manager implies personal assistance.
2. The Efficiency Loop ⚙️
This loop connects Key Activities, Key Resources, Key Partnerships, and Cost Structure. It focuses on the internal mechanics of delivering the value.
- Activities to Resources: Key activities require specific resources. If you need to produce high-quality goods, you need skilled labor and advanced machinery.
- Resources to Costs: Resources drive costs. High-end talent increases the cost structure. Understanding this link helps in budgeting and pricing.
- Partnerships to Activities: Partnerships often allow companies to outsource activities, reducing the need for internal resources and shifting costs to variable expenses.
3. The Financial Loop 💵
This loop ties everything together by connecting Revenue Streams to the Cost Structure and Value Proposition.
- Value to Revenue: The value proposition determines the willingness to pay. A unique proposition allows for premium pricing.
- Cost to Revenue: The cost structure dictates the margin. High fixed costs require high volume to break even, while high variable costs require high margins per unit.
- Revenue to Resources: Revenue generates the cash flow needed to fund resources and activities for the next cycle.
Table: Analyzing Interdependencies 📊
The following table illustrates how a change in one block impacts others across the loops.
| Change in Block | Impact on Value Loop | Impact on Efficiency Loop | Impact on Financial Loop |
|---|---|---|---|
| Customer Segment Shift | Value proposition may no longer fit; channels may need adjustment. | Resources may need retraining or replacement. | Pricing strategy must change; revenue model may shift. |
| Cost Structure Increase | May require higher pricing, affecting customer acquisition. | Efficiency improvements needed to offset costs. | Profit margins shrink unless revenue increases proportionally. |
| Key Activity Outsourcing | Quality control may affect customer relationships. | Fixed costs decrease; variable costs increase. | Cash flow improves initially; long-term dependency risk. |
| New Revenue Stream | May require new channels or value add-ons. | Additional resources or activities needed. | Revenue diversification reduces overall risk. |
The Feedback Loop: Iteration and Validation 🔄
A business model is not a finished product; it is a hypothesis. The feedback loop is the mechanism by which the organization tests its assumptions and refines the model. This involves metrics, data collection, and strategic pivots.
Metrics and KPIs 📈
To manage the loops, you need data. Key Performance Indicators must align with the specific blocks.
- Customer Metrics: Churn rate, customer lifetime value (CLV), net promoter score (NPS).
- Operational Metrics: Cycle time, defect rate, resource utilization.
- Financial Metrics: Burn rate, gross margin, return on investment (ROI).
Testing Hypotheses 🧪
Before scaling, validate the assumptions behind the loops.
- Value Hypothesis: Do customers actually want the product?
- Growth Hypothesis: How will new customers be acquired?
- Viability Hypothesis: Can we make money doing this?
When data contradicts the model, adjustments are necessary. This might mean pivoting the value proposition, changing the channel mix, or restructuring the cost base. The loop ensures the business remains aligned with market reality.
Common Disconnections and Risks ⚠️
Many organizations fail because the loops are broken. They treat the blocks in isolation. Below are common pitfalls.
1. Value Proposition Mismatch
A company builds a great product (Value Proposition) but targets the wrong audience (Customer Segment). The result is low adoption. The loop is broken at the source.
2. Cost vs. Revenue Imbalance
High-value propositions often require high costs. If the pricing mechanism (Revenue Stream) does not reflect the cost structure, the business burns cash. The financial loop collapses.
3. Channel Inefficiency
Using high-cost channels for low-margin products destroys profitability. The channel choice must match the economic model.
4. Resource Gaps
Key Activities are defined, but the necessary Key Resources are not secured. Execution fails because the foundation is missing.
5. Relationship Neglect
Acquiring a customer is one thing; retaining them is another. If Customer Relationships are weak, churn increases, and Customer Lifetime Value drops.
Strategic Alignment for Longevity 🏛️
Achieving alignment means ensuring that every block supports the others. This requires regular review sessions. Teams should walk through the canvas together, asking probing questions about each connection.
- Question 1: Does this resource directly enable a Key Activity?
- Question 2: Does this channel effectively reach the target segment?
- Question 3: Is the revenue model sustainable given the cost structure?
- Question 4: Do partnerships enhance capabilities without introducing too much dependency?
Alignment is not a one-time event. It is a continuous process of calibration. As markets evolve, the loops must be re-tuned. A static model becomes obsolete quickly.
Implementation Steps 🚀
How do you operationalize this analysis? Follow a structured approach.
- Map the Current State: Document the existing model accurately. Do not guess.
- Identify the Loops: Highlight the connections between blocks. Trace the flow of value and cost.
- Stress Test: Simulate changes. What happens if costs rise 10%? What if a key partner leaves?
- Define Metrics: Establish KPIs for each loop to monitor health.
- Execute and Monitor: Implement changes based on the analysis and track performance.
- Iterate: Use feedback to refine the model continuously.
The Human Element in the Model 🧠
While the canvas is logical, it relies on human execution. Culture plays a role in how the loops function. A culture of innovation supports rapid iteration in the feedback loop. A culture of efficiency supports tight cost controls in the efficiency loop. Leadership must foster an environment where the data from these loops is respected and acted upon.
Furthermore, communication across departments is vital. The sales team (Revenue) must understand the production constraints (Resources). The product team (Value) must understand the marketing reach (Channels). Silos break the loops. Cross-functional collaboration strengthens them.
Summary of Strategic Insights 📝
Analyzing the interconnected loops of the Business Model Canvas transforms it from a drawing exercise into a strategic engine. It reveals the dependencies that drive performance. By focusing on the relationships between segments, propositions, channels, resources, and financials, organizations can build more resilient and adaptable models.
The path to success lies in recognizing that no block exists in a vacuum. The value flows through the system, and the costs flow against it. The goal is to maximize the velocity of value while minimizing the friction of costs. Continuous monitoring of the feedback loops ensures that the model remains relevant in a changing world.
When the loops are tight, the business operates with precision. When they are loose, inefficiency and risk creep in. A winning model is one where every component reinforces the others, creating a cohesive system capable of sustained growth.