


Ever feel like your product portfolio is a tangled mess, with some items shining and others just… well, not? If you’re a business leader, product manager, or strategist in the fast-paced world of consumer electronics and IoT, you know how crucial it is to make smart decisions about where to invest your time and money. That’s where the BCG Matrix Analysis Tool from Visual Paradigm comes in. This AI-powered tool is like having a strategic advisor at your side, guiding you through a simple 5-step process to analyze your entire product lineup and make it crystal clear which products to double down on, which to milk for profits, and which might need to be retired. The best part? It can generate a complete, professional analysis in minutes, saving you hours of manual work.
Quick Summary: Your AI-Powered Product Strategy Guide
-
What it is: An AI-powered online tool to analyze your product portfolio using the BCG Matrix framework.
-
How it works: Enter your business details, let the AI generate a full analysis, then review and refine the results in a guided 5-step wizard.
-
Key benefits: Get instant clarity on your products, make smarter investment decisions, and create a professional report to share with your team.
-
Who it’s for: Business strategists, product managers, executives, and MBA students.
-
Key feature: The AI can generate a complete BCG Matrix from just a brief description of your business.
Let’s walk through the process using a real-world example. Imagine you run a company called SmartHome Dynamics, which designs and markets connected smart home devices like security systems, sensors, and home automation hubs. You’re not sure how to prioritize your resources, so you decide to use the BCG Matrix Analysis Tool. The first thing you’ll see is the AI generation screen, where you provide your business context.
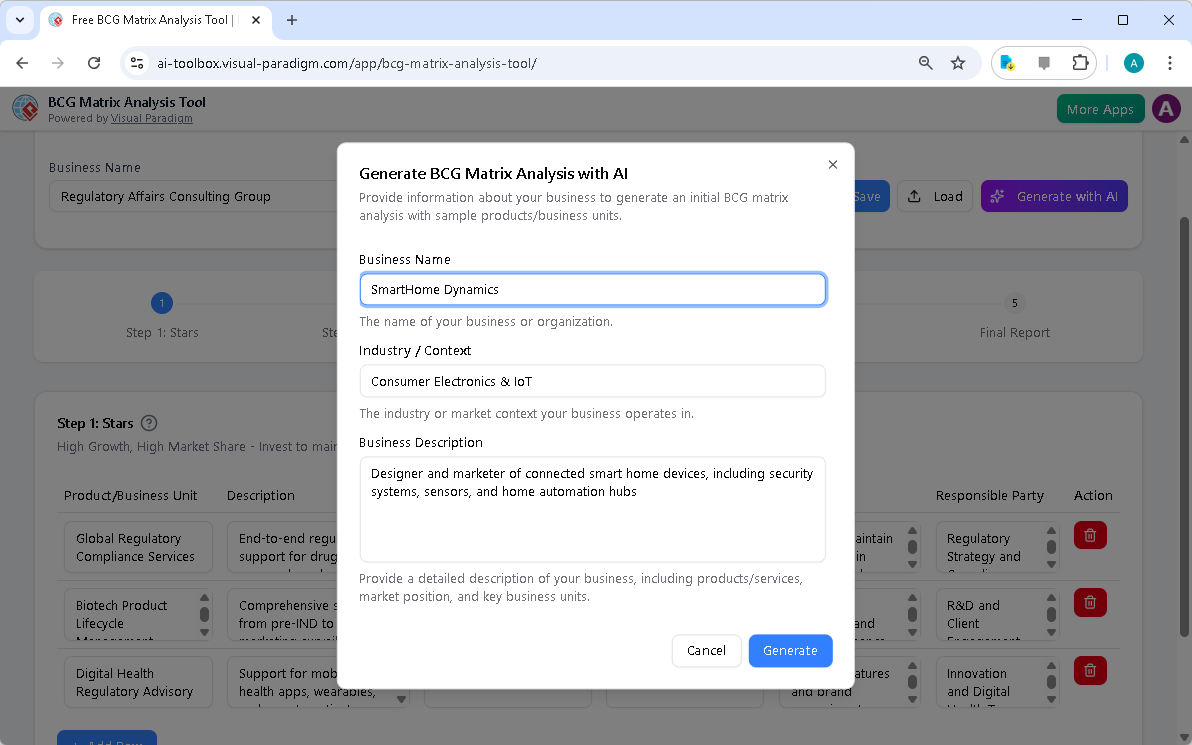
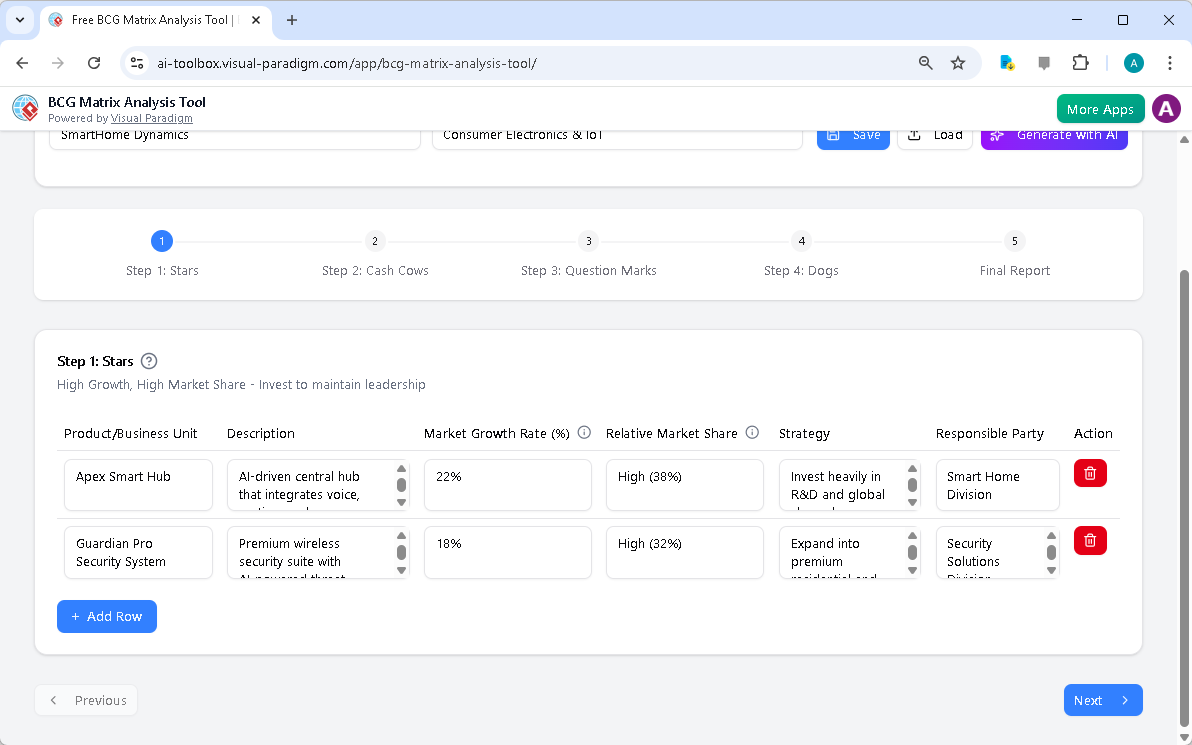
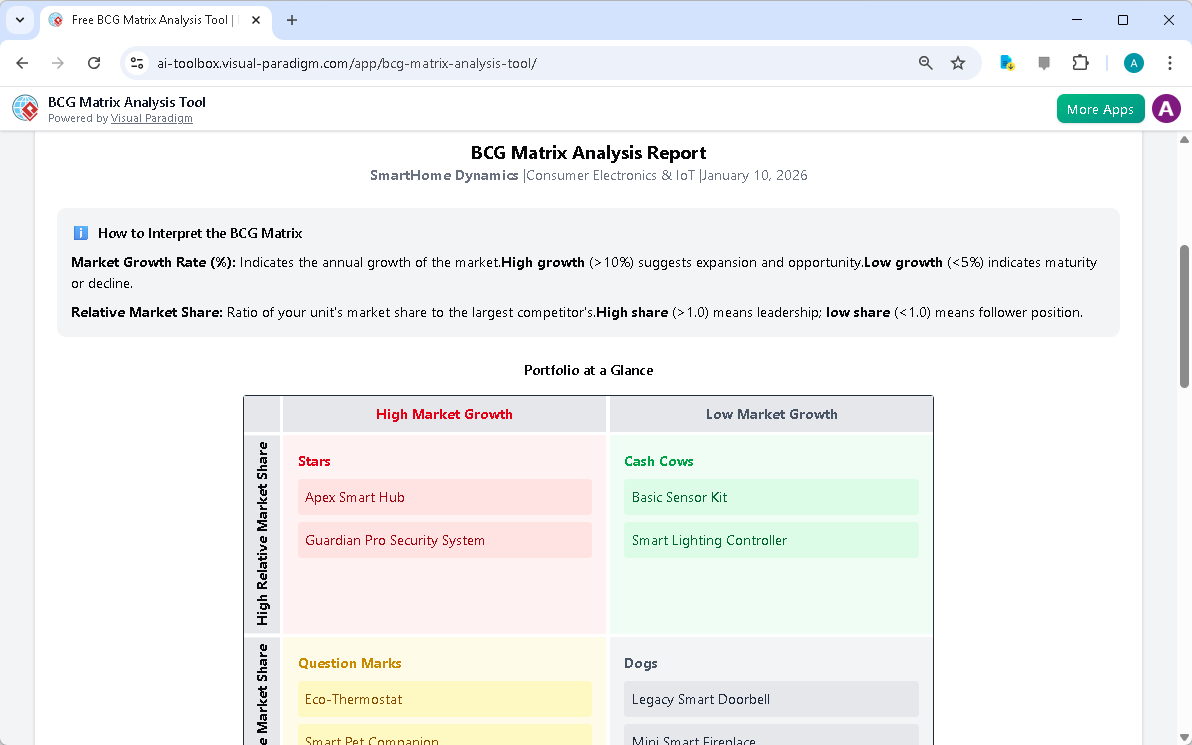
After entering your business name, industry, and a brief description, you hit the “Generate with AI” button. The tool then does the heavy lifting, populating the first quadrant, “Stars,” with products that have high market share in high-growth markets. In our example, the AI suggests the “Apex Smart Hub” and “Guardian Pro Security System” as Stars, with strategies like “Invest heavily in R&D and global expansion.” This is a huge time-saver, giving you a solid starting point for your strategic planning.
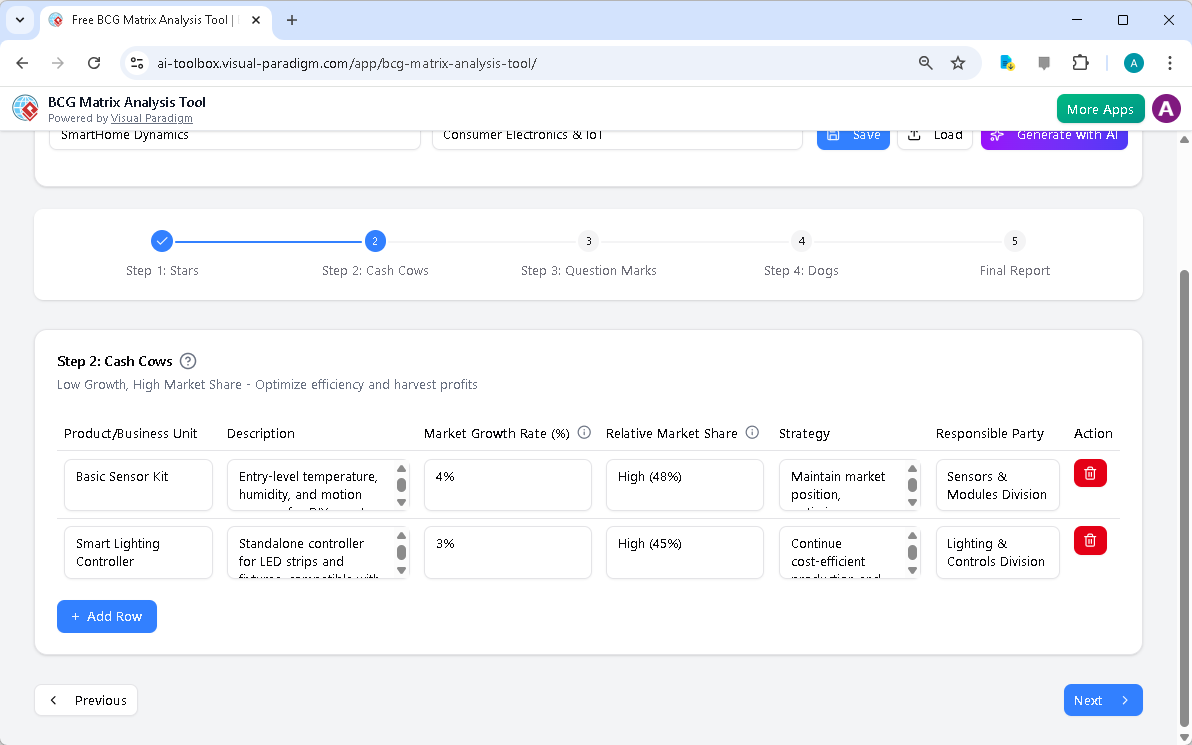
Next, you move to Step 2, “Cash Cows.” These are your mature, profitable products that generate a lot of cash with minimal investment. The AI populates this section with items like the “Basic Sensor Kit” and “Smart Lighting Controller,” which are described as having high market share but low growth. The recommended strategy is to “Maintain market position” and “Optimize efficiency.” This helps you identify which products are your reliable cash flow engines.
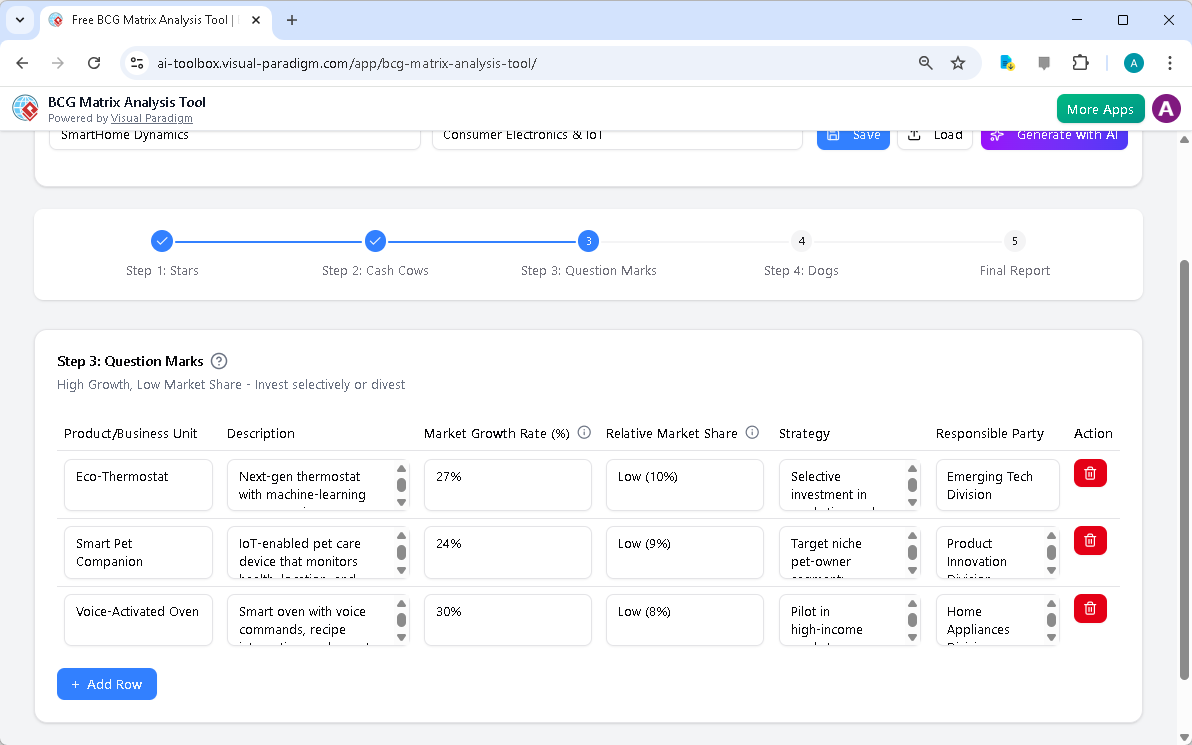
Step 3 focuses on “Question Marks,” which are products with high growth potential but low market share. They’re risky but could be the next big thing. The AI suggests products like the “Eco-Thermostat” and “Smart Pet Companion,” which are in high-growth markets but have low market share. The strategy here is to “Invest selectively” or “divest.” This forces you to make a hard decision: do you want to pour more resources into a potentially lucrative product, or is it better to cut your losses?
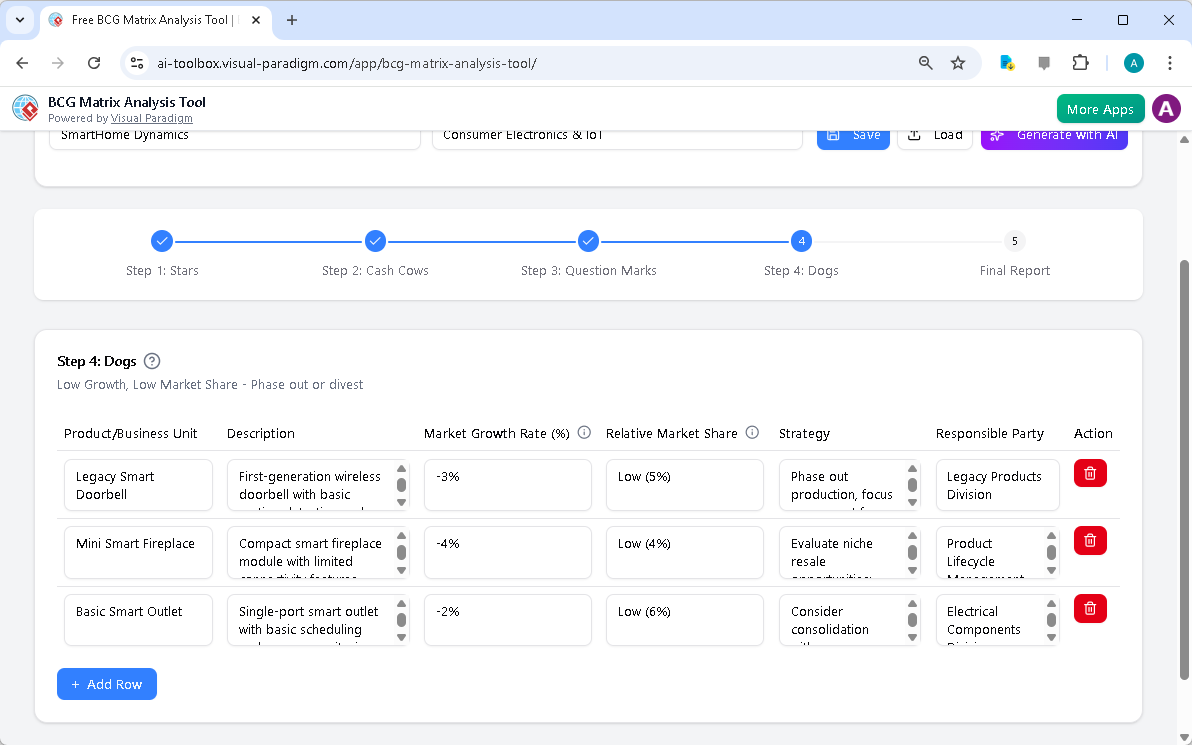
Finally, you reach Step 4, “Dogs.” These are products with low market share in low-growth markets. They’re often a drain on resources. The AI lists items like the “Legacy Smart Doorbell” and “Mini Smart Fireplace,” which are described as having negative growth rates. The recommended strategy is to “Phase out production” or “Consider consolidation.” This is the tough part of portfolio management, but it’s essential for long-term health.
Once you’ve reviewed and refined all four quadrants, you move to the final step: the “Final Report.” This is where the magic happens. The tool compiles all your data into a clean, professional document that visually summarizes your entire product portfolio. You can see at a glance which products are Stars, Cash Cows, Question Marks, and Dogs. The report also includes helpful explanations of the BCG Matrix terms, making it easy to understand the analysis.
At this point, you’re ready to take action. You can print the report, save it as a PDF, or even share it with your team to get their input. The entire process is incredibly intuitive, with a clear 5-step wizard that guides you through each stage of the analysis. And the best part? Your data is saved locally on your computer, so your sensitive business information stays private and secure. The BCG Matrix Analysis Tool is a powerful way to gain clarity on your product portfolio and make smarter, data-driven decisions. Ready to see how it can work for your business? Try it now and create your own strategic roadmap.
Try the BCG Matrix Analysis Tool Now
Related Links
-
Free BCG Matrix Tool for Strategic Portfolio Analysis: Unlock strategic clarity with our free BCG Matrix Analysis Tool . Visualize your product portfolio, identify growth opportunities, and optimize resource allocation.
-
BCG Matrix Analysis Tool Review: AI-Powered Strategic Planning: The Visual Paradigm BCG Matrix Analysis Tool emerges as a digital solution designed to modernize this classic framework. …
-
BCG Matrix Tool – Visual Paradigm: Start quickly with pre-made BCG Matrix templates The Boston Consulting group’s product portfolio matrix ( BCG matrix ) is a business tool …
-
Free BCG Matrix Analysis Tool | Build Your Portfolio Strategy: Input your product data to instantly generate a BCG Matrix . Analyze Stars, Cash Cows, Question Marks, and Dogs to optimize your business strategy with our free online tool .
-
BCG Matrix Analysis Tool – Visual Paradigm: The BCG Matrix Analysis Tool guides you from raw data to a refined, presentation-ready report in five simple stages. Step 1: Identify “Stars” Document the products or business units with high market share in high-growth markets. Step 2: Identify “Cash Cows” Record the products or business units with high market share in low-growth markets.
-
Free AI-Powered BCG Matrix Tool for Portfolio Analysis – Visual …: Analyze your product portfolio with our free AI -powered BCG Matrix tool . Easily classify products as Stars, Cash Cows, Question Marks, or Dogs to make smarter investment decisions.