


Introduction to Flowcharts
A flowchart is one of the most widely used diagrams in business, engineering, and programming. At its core, it is a graphical representation of steps, depicting the flow of algorithms, workflows, or processes sequentially. By utilizing specific shapes—such as boxes, diamonds, and ovals—connected by arrows, flowcharts transform complex logic into visual narratives that are easy to understand and analyze.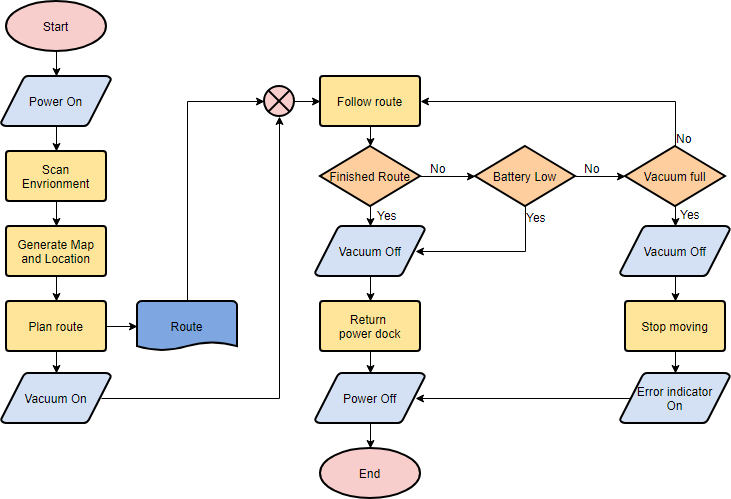
Originating from computer science as a tool for representing programming logic, flowcharts have evolved to serve every industry. Whether it is defining a supply chain management process, visualizing a medical diagnosis procedure, or outlining a customer service script, these diagrams help teams make explicit the structure of problems and tasks.
Essential Flowchart Symbols and Semantics
To create a standard, readable flowchart, it is crucial to understand the conventional meanings behind the specific shapes used. While modern tools offer flexibility, adhering to these standards ensures your diagram is universally understood.
- Terminator: Usually represented by an oval or rounded rectangle, this symbol marks the starting or ending point of a system or process.
- Process: A rectangle indicates a specific operation or action step within the workflow.
- Decision: A diamond shape represents a branching point where a decision must be made (e.g., Yes/No, Pass/Fail). Lines emerging from the diamond lead to different sub-processes based on the outcome.
- Data (Input/Output): A parallelogram represents information entering or leaving the system, such as a customer order (input) or a generated report (output).
- Document: A wave-bottomed rectangle represents a printout, such as a report or physical document.
- Delay: A D-shaped symbol identifies a delay or bottleneck in the process workflow.
- On-Page/Off-Page References: Small circles (on-page) or pentagons (off-page) containing letters indicate that the flow continues elsewhere, either on the same page or a different one, maintaining organization in complex diagrams.
The Benefits of Visualizing Processes
Implementing flowcharts into your documentation and planning strategies offers immediate benefits. Primarily, they clarify complex processes, making abstract algorithms or workflows tangible. They allow teams to identify steps that do not add value, such as redundant loops, unnecessary storage, or communication breakdowns.
Furthermore, flowcharts serve as a foundational tool for designing new processes. By visualizing the intended workflow before implementation, organizations can gain a shared understanding, focus discussions on critical decision points, and allocate resources more effectively.
Modern Diagramming: AI and Online Tools
The landscape of diagramming has shifted from manual drawing to intelligent, automated solutions. Modern flowchart makers, such as Visual Paradigm Online, have introduced features that significantly enhance productivity and collaboration.
AI-Powered Generation
One of the most significant advancements is the integration of Artificial Intelligence. Users can now generate diagrams instantly from text. By simply describing a requirement—such as “An ATM System” or “Online Learning Platform”—AI tools can interpret the intent, fill in missing details, and build a perfectly laid out diagram. This technology ensures balanced spacing and alignment, allowing professionals to focus on the ideas rather than the mechanics of drawing.
Collaboration and Compatibility
Modern tools emphasize cloud-based collaboration, allowing team members to edit diagrams in real-time and add comments for discussion. Additionally, integration with MS Office products (Word, Excel, OneNote) and compatibility with Visio files makes switching to modern web-based platforms seamless. Users can export their work in various formats, including PNG, JPG, SVG, and PDF, for reporting and presentations.
Industry Use Cases
Flowcharts are versatile and applicable across virtually all sectors. Below are examples of how different industries utilize these diagrams:
- Software Development: Visualizing algorithms, login processes, git branch systems, and user experience (UX) flows.
- Business & HR: Mapping hiring processes, employee onboarding/offboarding, performance reviews, and organizational decision-making.
- Healthcare: Standardizing medical diagnosis procedures, hospital patient admission processes, and emergency response protocols.
- Supply Chain & Manufacturing: Tracking inventory management, quality control processes, order fulfillment, and procurement logistics.
- Sales & Marketing: Designing customer journey maps, content marketing workflows, and sales funnel processes.
Step-by-Step Tutorial: Creating a Flowchart
Creating a flowchart is a straightforward process, whether you are using a desktop application or an online tool. Below is a generic guide to building a simple e-commerce workflow (e.g., “Add items to Cart”).
1. Initialization
Begin by selecting a “Flowchart” from your diagramming tool’s new diagram menu. You can often choose to start from a blank canvas or select from thousands of pre-made templates depending on your needs.
2. Define the Start Point
Drag a Terminator (Start) symbol onto the canvas. Label it “Start” to define the trigger of the process.
3. Map the Process Steps
Utilize the Process rectangles to map out the actions. For a shopping workflow, this might involve steps like “Add items to Cart,” “Checkout Shopping Cart,” and “Settle Payment.” Connect these boxes sequentially using directional arrows (flow lines).
4. Incorporate Decisions
If the user needs to log in before paying, insert a Decision diamond. One path (Yes) leads to payment; the other path (No) leads to a “Login Process” sub-routine.
5. End the Process
Conclude the workflow with a final Terminator labeled “End” or “Order Complete.” Once the structure is in place, you can use formatting tools to color-code shapes, ensuring the diagram is visually appealing and easy to read.
Conclusion
From simple daily timetables to complex industrial algorithms, flowcharts remain the easiest and most powerful way to visualize processes. With the advent of AI diagram generation and real-time collaboration, creating these diagrams has never been more accessible. By mastering standard symbols and utilizing modern tools, professionals can communicate complex logic with clarity and precision.