


Introduction to UML Activity Diagrams
In the realm of software engineering and business process modeling, clarity is paramount. The UML Activity Diagram stands as one of the most critical behavioral diagrams in the Unified Modeling Language (UML) suite. It serves as a visual map for describing the dynamic aspects of a system, essentially functioning as an advanced, standardized flowchart that models the flow from one activity to another.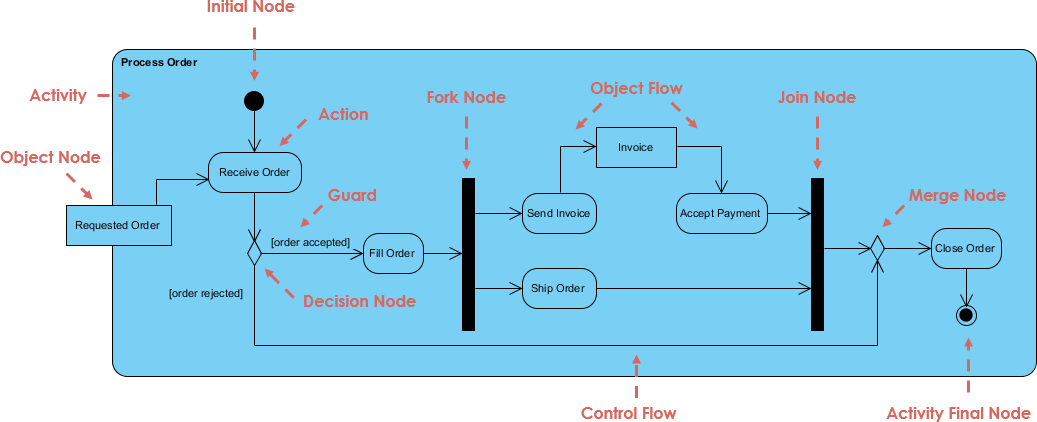
Unlike static diagrams that show structure, activity diagrams capture the essence of execution. They describe how activities are coordinated to provide a service, ranging from high-level business workflows to the internal logic of a specific programming function. By illustrating sequence, concurrency, and conditions, these diagrams provide stakeholders with a clear understanding of system behavior.
When to Use Activity Diagrams
Activity diagrams are versatile and can be applied at various levels of abstraction. They are particularly effective when examining business workflows to identify candidate use cases or when modeling the specific logic within a use case.
You should consider using an activity diagram in the following scenarios:
- Modeling Business Workflows: To represent how a collection of use cases coordinates to support a business process.
- Visualizing Logic: To detail the operational steps of a complex algorithm or method on an object.
- Identifying Dependencies: To identify pre-conditions and post-conditions for use cases.
- Handling Concurrency: To illustrate operations that occur in parallel versus those that must happen sequentially.
Key Notation and Symbols
To effectively read and create activity diagrams, one must understand the standard UML notation. These symbols form the vocabulary of the diagram.
| Notation Element | Description |
|---|---|
| Activity | Represents a set of actions or a major task within the workflow. |
| Action | A single step or atomic task to be performed. It is the fundamental unit of work. |
| Control Flow | The connector (arrow) that shows the sequence of execution from one node to another. |
| Initial Node | A solid circle portraying the beginning of a set of actions or activities. |
| Activity Final Node | A solid circle with a border representing the end of the entire process, stopping all flows. |
| Decision Node | A diamond shape representing a test condition. It ensures the control flow goes down only one specific path based on criteria. |
| Merge Node | Used to bring back together different decision paths created by a decision node. |
| Fork Node | A bar used to split behavior into a set of parallel or concurrent flows. |
| Join Node | A bar used to synchronize and bring back together a set of parallel flows. |
Understanding Control Flow: Serial vs. Parallel
One of the distinct advantages of activity diagrams over simple flowcharts is the ability to model parallel processing explicitly.
Sequential Flow Example: Word Processing
In a standard sequential workflow, such as creating a document in a word processor, actions follow a linear path. The user opens the package, creates a file, types the document, saves it, and prints it. While decision nodes may exist (e.g., “If graphics are necessary, open graphics package”), only one path is active at a time.
Parallel Flow Example: Order Processing
Complex business processes often require tasks to happen simultaneously. Consider an order processing system:
- Start: An order is received.
- Fork (Split): The process splits into two parallel threads. One team fills the order, while the finance system handles billing.
- Conditional Logic: On the fulfillment side, a decision is made regarding delivery (Overnight vs. Regular) based on user selection.
- Join (Synchronization): The process cannot close until both the billing is complete and the order is filled. The Join node ensures both parallel activities are finished before moving to the final state.
- End: The order is closed.
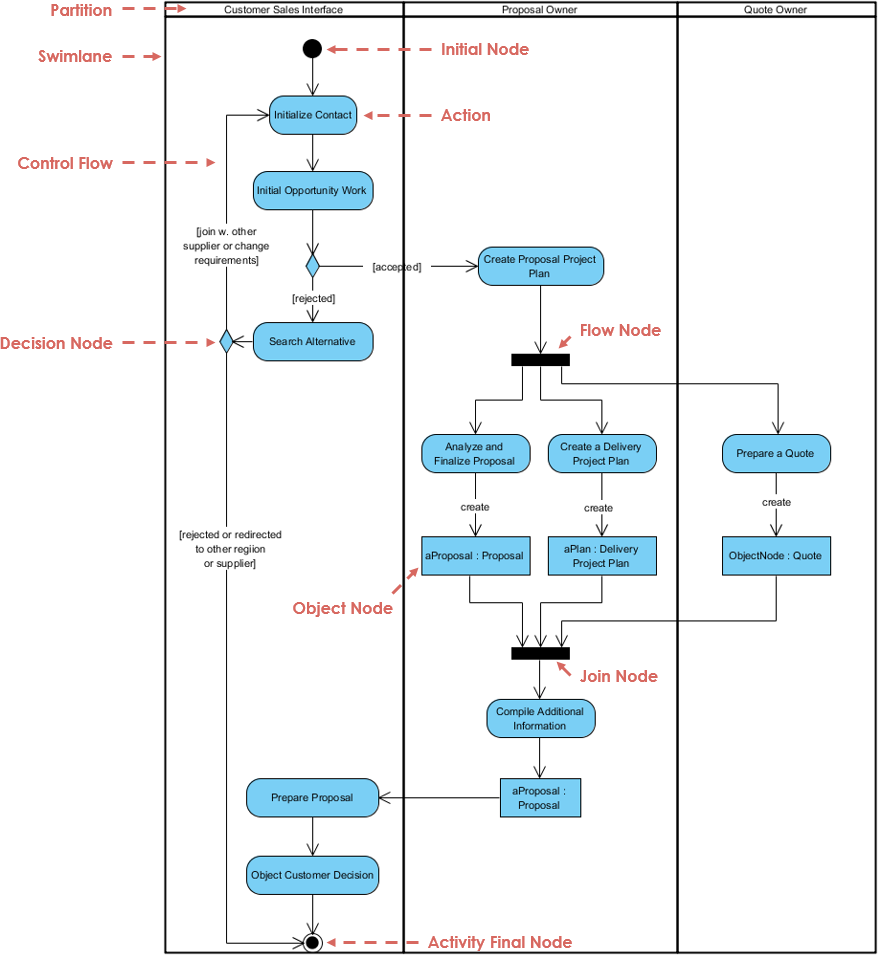
Structuring Responsibilities with Swimlanes
As processes grow in complexity, it becomes essential to define who is performing an action. Swimlanes (or Partitions) are used to group activities performed by the same actor, department, or system component.
For example, in a Student Enrollment process, the diagram might be divided into vertical or horizontal lanes representing the Applicant and the Registrar. The control flow arrows cross these lines to show hand-offs:
- Applicant Lane: Hands in the filled enrollment form.
- Registrar Lane: Inspects forms, determines validity, and informs the student of the next steps.
- Applicant Lane: Pays tuition.
Using swimlanes creates a “Responsibility Matrix” within the flow diagram, identifying bottlenecks or imbalances in workload distribution immediately.
Accelerating Design with AI
Traditionally, creating these diagrams involved manually dragging shapes, connecting arrows, and formatting layouts. However, modern tools like Visual Paradigm have introduced AI-powered workflow generation to streamline this process.
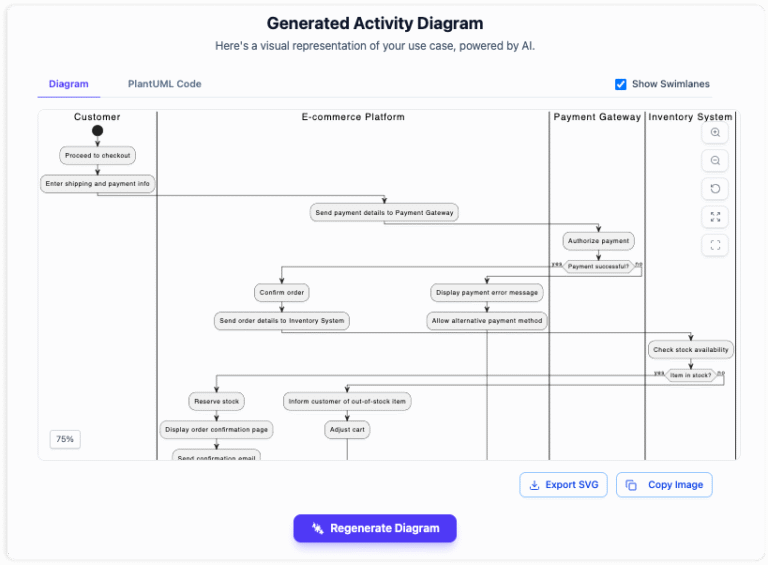
Text-to-Diagram Generation
Instead of manual drafting, users can now describe a process in plain language. For instance, prompting an AI tool with “Generate an activity diagram for an Airport Check-In and Boarding Process” will automatically construct a structured diagram.
Benefits of AI-Assisted Modeling
- Instant Notation Accuracy: The AI ensures that complex elements like forks, joins, and decision nodes use the correct UML syntax automatically.
- Rapid Iteration: Users can refine workflows conversationally. If a step needs to be reordered or a condition added, a simple text command updates the visual model instantly.
- Focus on Logic: By removing the burden of manual formatting, analysts can focus on the logic of the system rather than the alignment of shapes.
Conclusion
Whether you are documenting a legacy business process or designing the logic for a new software application, the UML Activity Diagram is an indispensable tool. It bridges the gap between static structure and dynamic behavior, allowing teams to visualize execution paths clearly. With the advent of AI-driven modeling tools, creating these diagrams has become faster and more accessible, enabling professionals to turn plain text descriptions into comprehensive visual workflows in seconds.